
Everybody is keeping his eye on BTC price in these days, but what about the situation from the point of view of price action?
At present BTC price has been ranging between 24,700$ and 18,000$ since June 2022 as you can see from the graph below:
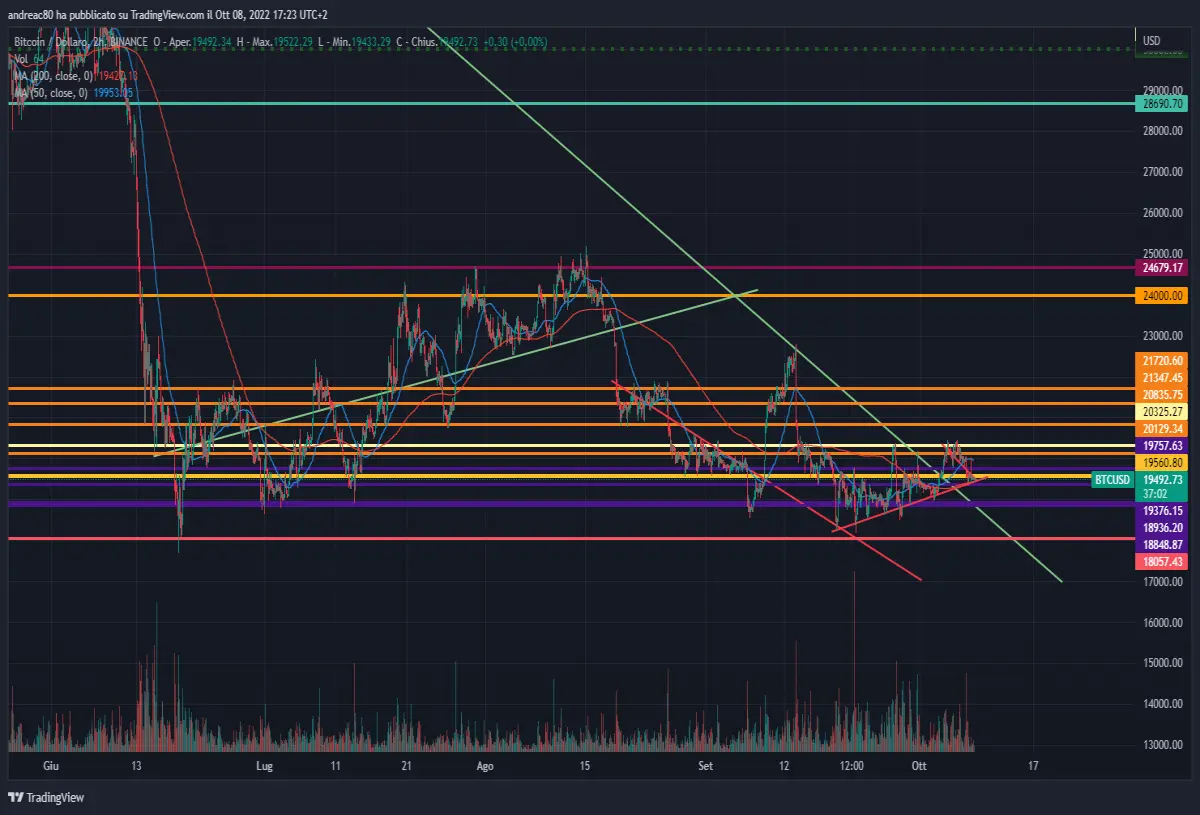
What is significant of these last days is that BTC broke the descending trendline that was driving it's bearish descent since the last ATH, you can see it in this graph:
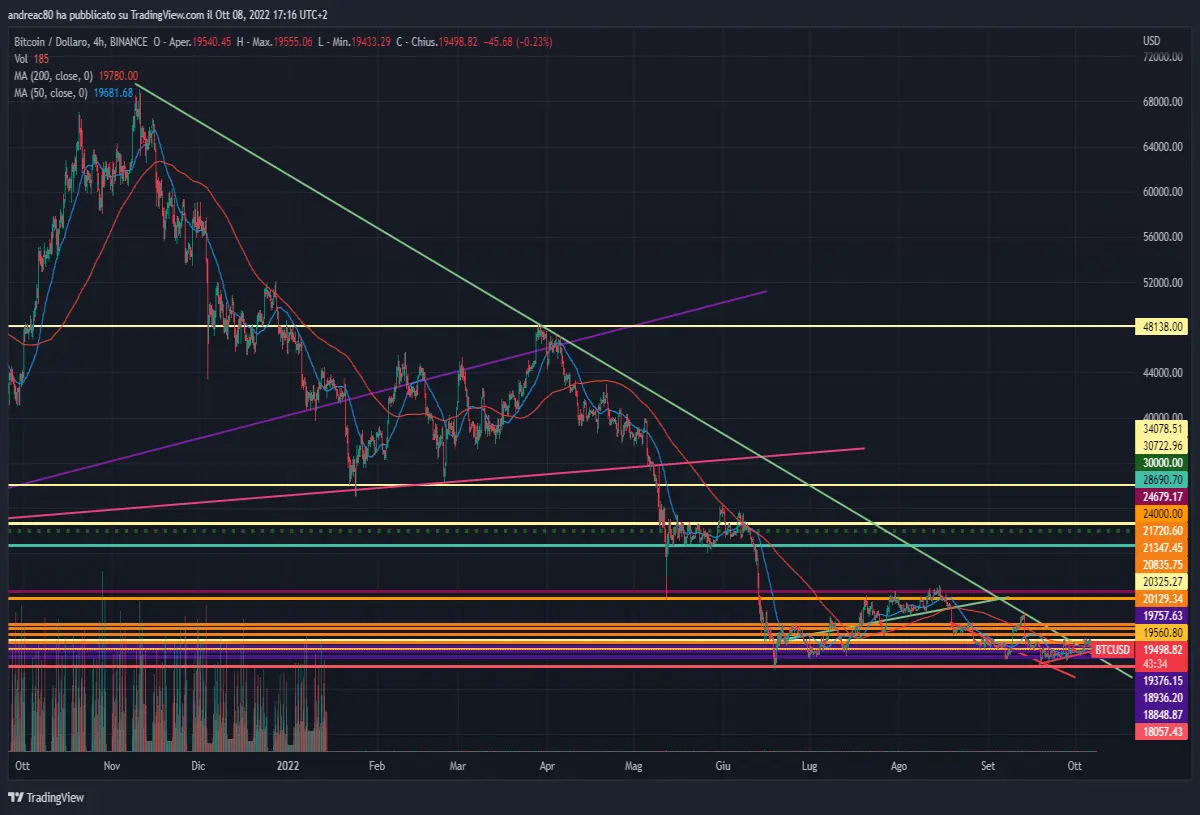
However the broken resistance still has to be tested to avoid the risk of falling below again.
Now BTC is closing into a wedge constituted by a month standing ascending support and a bearish descending trendline, also the orange resistance at 19,560$ will represent a barrier for price improvements.
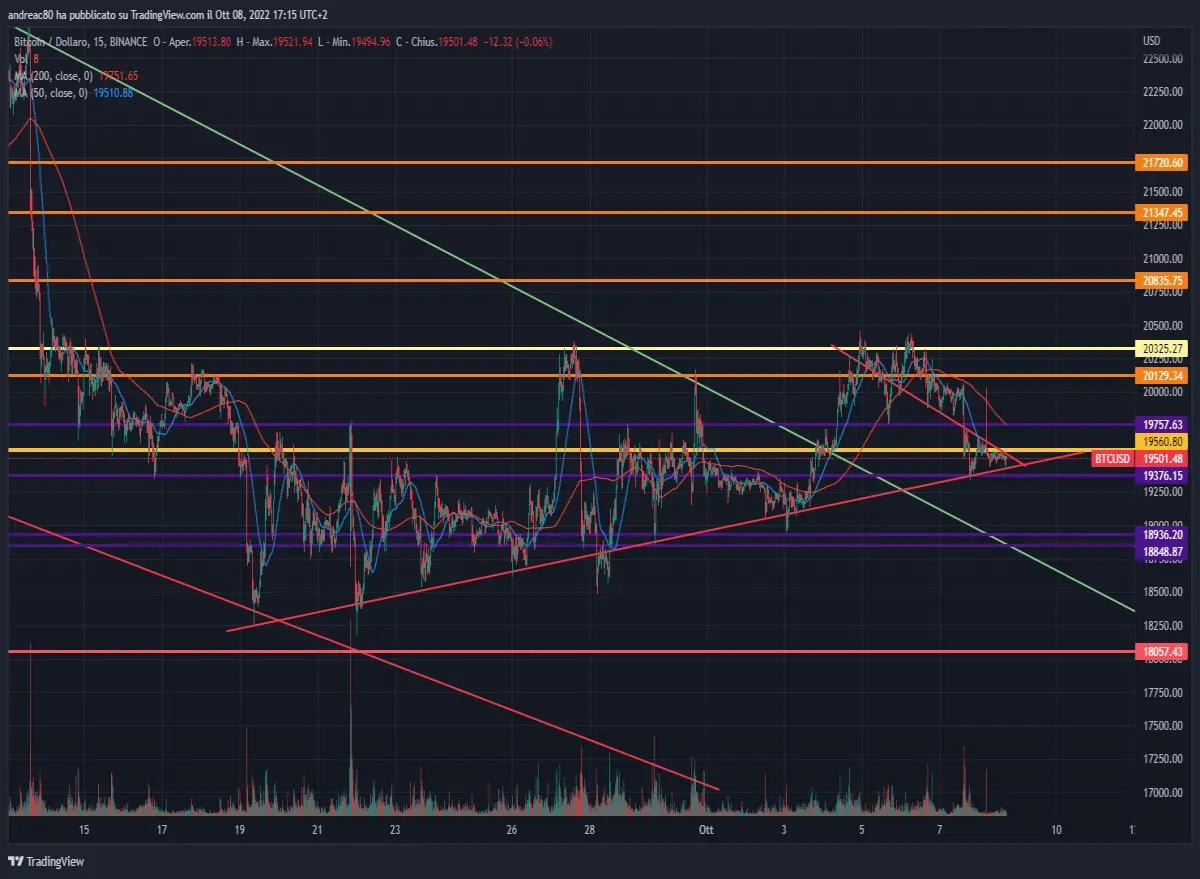
The next days will be significant into giving a hint on price action for the month of October, also considering that on 13th Oct fresh Consumer Price Index data will be released for the month of September.
Should BTC fall again below the green trendline coming down from the ATH, it would open the road for furter descent of the price. Should the retesting of the green trendline come out victorious I believe price should keep stabilising around this level or even improve.
This is my first attempt at price action comments, please let me know if you like it





