
Welcome to Bitcoin Monthly Trends.
Through different on-chain and market interest metrics, we will carry out a small exhaustive analysis of the Bitcoin market situation at the end of every month. The metrics shown in this article give a detailed view of the market from 3 relevant perspectives:
- 90-Days Bitcoin Distribution – Accumulation: This metric reflects the status of BTC wallets within your blockchain in the last 90 days. Through it we observe when the whales (addresses with 10-1k BTC) and the retail (Less than 1 BTC) accumulate or move their coins. This indicator offers a view of the market in the short term.
- Awakening of Dormant Bitcoin (30D vs 1D): this metric identifies when Bitcoin that has been dormant for more than 30 days is put back into circulation. When sleeping coins wake up it is usually to be spent or sold. The moment when many currencies wake up from their slumber is usually the top zone. The areas in which it lateralizes are usually accumulation areas. This indicator offers a long-term view of the market.
- Bitcoin Google Trends Attention: attending to searches related to Bitcoin in Google, we generate an indicator of the degree of attention that the cryptocurrency receives. When attention is very high, it is a sign that the market is in FOMO. On the contrary, when attention is very low, it is a good accumulation zone for the long term. This indicator offers a long-term view of the market. You can follow this indicator daily on Twitter: @BTCGoogleTrends
After the introduction to the metrics used, we continue to develop the monthly report on the state of the Bitcoin market.
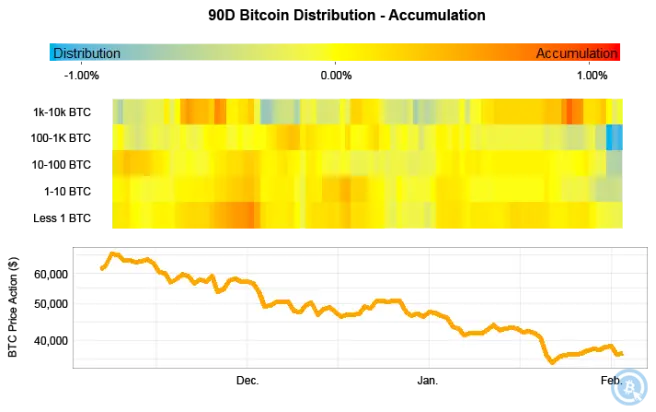
In the last 90 days, the price of BTC has plummeted from ATH ($69,000) to $33,000. The global crash has been marked by small distributions by whales (wallets with 1k-10k Bitcoin units). However, in recent days we have been able to observe an accumulation by the whales in the lows, which may indicate a bottom. However, a strong distribution by sharks (wallets with 100-1k Bitcoin units) is also observed. In summary, the 90D Distrinutcion-Accumulation indicator does not give us the exact situation of the market, although we know that the whales have bought the recent bottom.
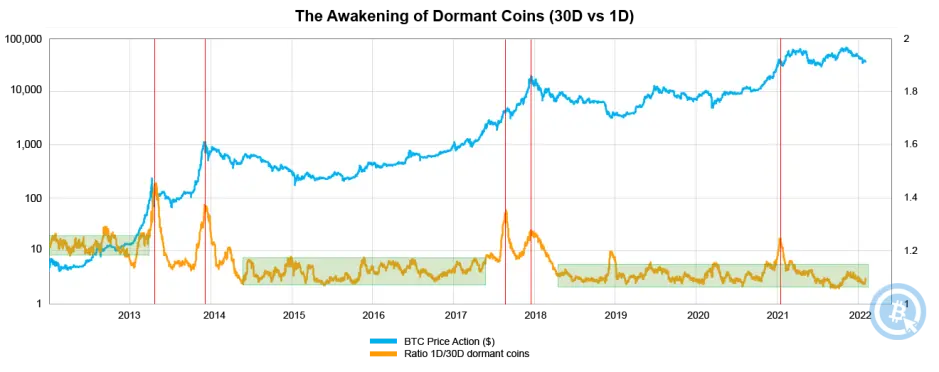
Through Awakening of Dormant Coins we approach a longer-term perspective where we can visualize that we are still in an accumulation zone (green shaded zone). The peaks show the areas where coins that have been dormant for a long time are put back into circulation, exactly coinciding with large selling areas and market tops. Based on this indicator, it seems logical to expect a second spike caused by a possible FOMO as in previous bullruns. However, these are only assumptions. What we can guarantee is that we are currently still in the accumulation zone.
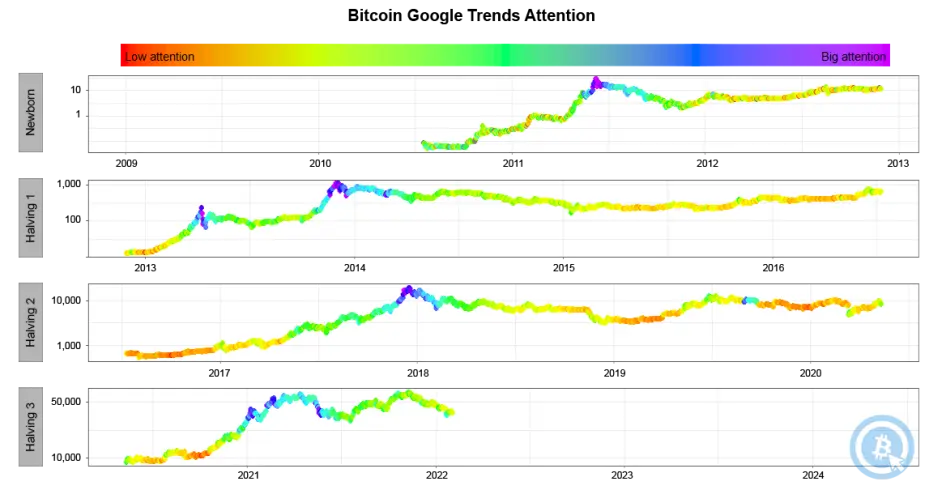
Finally, considering the attention that Bitcoin is receiving through searches on Google, we can say that we are still in an area of "low attention" (red and yellow). These zones are ideal for accumulating Bitcoin for the long term. The retail behavior in this 2021 bullrun has been very similar to that in 2013. Looking at what has happened in the past, we can expect a new large bull run to take place throughout this year, but as we said before, these are just dubious assumptions. What is clear is that the attention currently focused on BTC is far from being at its maximum, so thinking about accumulating is ideal for the medium and long term.
Summary of the Bitcoin market state in January 2022 according to metrics displayed:
- 90 days Bitcoin Distribution – Accumulation: The whales have bought the bottom. It is usually a symptom that the price will not fall further. Possible start of uptrend.
- Awakening of dormant Bitcoin (30D vs 1D): There have been no massive movements of dormant coins. We are still in the accumulation zone.
- Bitcoin Google Trends Attention: Attention and low interest. Accumulation area.






