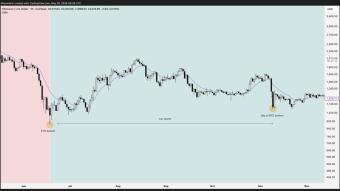
Bitcoin is exhausted. In recent days, prices have been hovering at the same levels and there is no significant signs that this state have solution upwards. Price moves is like weather. Predictable, but you never know for sure what will happen in the future. From the technical point of view correction seems to be inevitable.
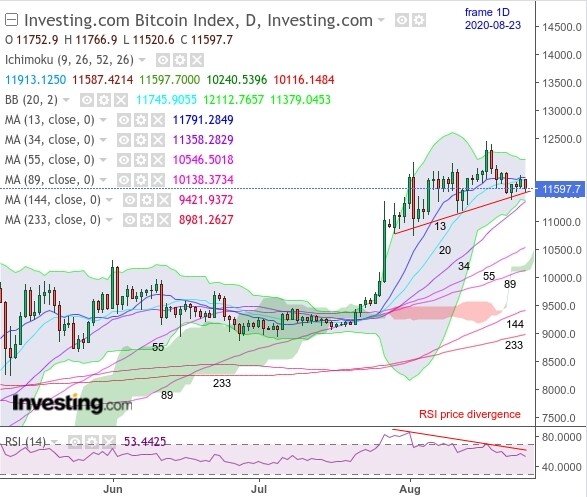
Chart of Bitcoin price [(c) Investing.com thanks for great charts] indicates some not so good signs of trend exhaustion. First bad sign is divergence between price and RSI. Price is also high above Ichomoko cloud which is sign of significant oversold state and chance of immediate move upwards is minimal in the near future. Some good pit stops for price can be spotted on moving averages set in Fibonacci proportions [ 8, 13, 21, 34, 55, 89, 144, 233, 377, ....]. These moving averages are resistance levels at which the price bounces with a higher probability. So probable resistance levels can be found at 10600, 10400, 9500 or 9000 USD/BTC.
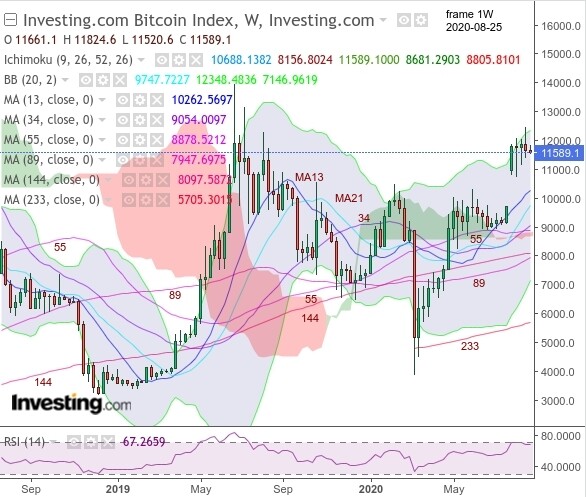
Price chart with week frames also indicates some resistance MA levels in area from 10400 to 9000 BTC/USD. If relay catastrophic sell of happen 8000 to 6000 BTC/EUR levels will be the last belt of defense, but this scenario is almost of the table.
**This is for this post. Have your say in the comments section. And follow me because I decided to post pure TA on a regular basis.**