
As part of technical analysis in cryptocurrencies, we looked at the fundamentals of price action, support and resistance, and trendlines. These instruments are considered simple, and moving averages are another easy tool that many new traders employ.
The average price of an asset over a given period of time is known as a moving average. Simple Moving Average (SMA) and Exponential Moving Average (EMA) are the two types of moving averages (EMA). Today, we'll look at the SMA and use it to examine Litecoin's price behavior.
Measuring the average of an asset's closing values over a length of time yields a Simple Moving Average. The closing prices are totaled and divided by the number of days in the timespan.
For example, the closing prices for the last three days on BigoMex's Litecoin daily chart are $181, $182, and $186. ($181 + $182 + $186)/3, or $183, is the moving average.
We can conclude that a moving average is a lagging indicator from this computation. This indicates that this analysis tool follows a trend by combining historical and present prices. As a result, it is better suited to long-term investments than short-term trades.
Which Moving Average to Use
The price of an asset is smoothed using moving averages. The goal is to limit the impact of price variations that are random or unexpected on trend analysis. A trader can evaluate without getting distracted by sudden wicks by looking at a smooth moving average.
Moving averages for periods of 15 days, 20 days, 30 days, 50 days, 100 days, and 200 days are the most prevalent. On a chart, traders frequently employ multiple moving averages. Longer durations are less sensitive to price movements, which means they track prices more slowly than shorter intervals.
The most significant moving averages are the 50-day and 200-day moving averages. Traders can employ shorter-period moving averages for short-term trading and longer-period moving averages for long-term transactions, but the 50-day and 200-day moving averages can provide a comprehensive analysis.
On a chart, a moving average can be utilized as a support and resistance level. When a crypto asset's price is above a moving average and subsequently falls toward it, the moving average works as a support. When the price falls below a moving average, the SMA acts as resistance.
Analyzing Litecoin Using SMA
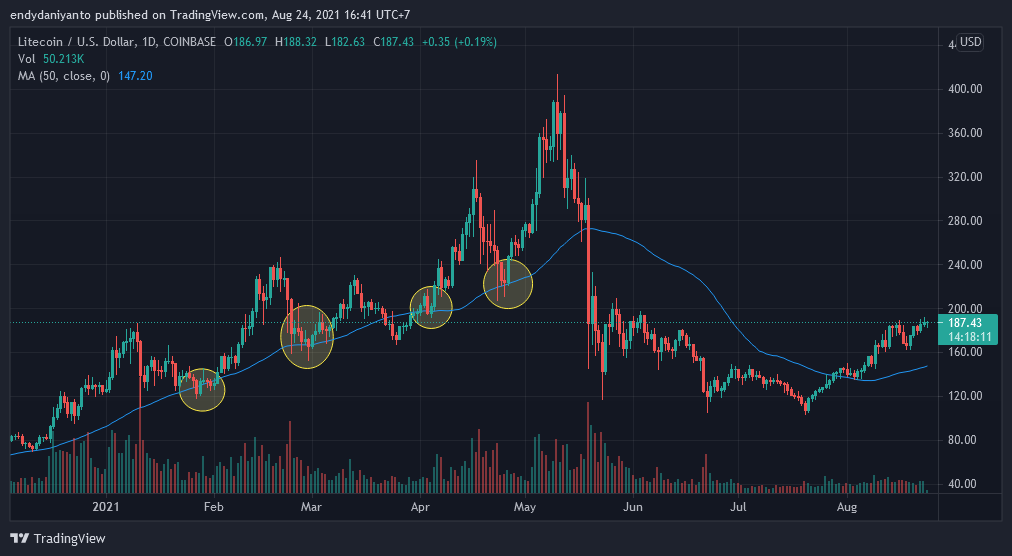
The price of Litecoin has been in a bullish trend since November of last year, according to the daily chart. A SMA might be an excellent point to purchase or go long in several instances.
In late January, late February, late April, and late March, the price of LTC touched the 50-SMA multiple times since January. All of these prices were fantastic entry points for buying LTC or a long contract on BigoMex.
Litecoin's price rose every time it struck the 50-day moving average. It did, however, hit the 50-SMA in the middle of May before breaking down beneath it. The 50-SMA has acted as resistance, but the price of LTC has just risen beyond it.
As a result, buying Litecoin following a confirmed recovery from the 50-SMA as a support level could be a viable strategy moving forward. BigoMex allows you to trade Litecoin contracts with a minimum margin of 2 USDT, making it a viable option for those with limited funds.


