
In recent days, we’ve been observing Solana’s (SOL) price action, which shows signs of approaching an uptrend, despite markets closing slightly in the red yesterday. Two key technical indicators support this outlook.
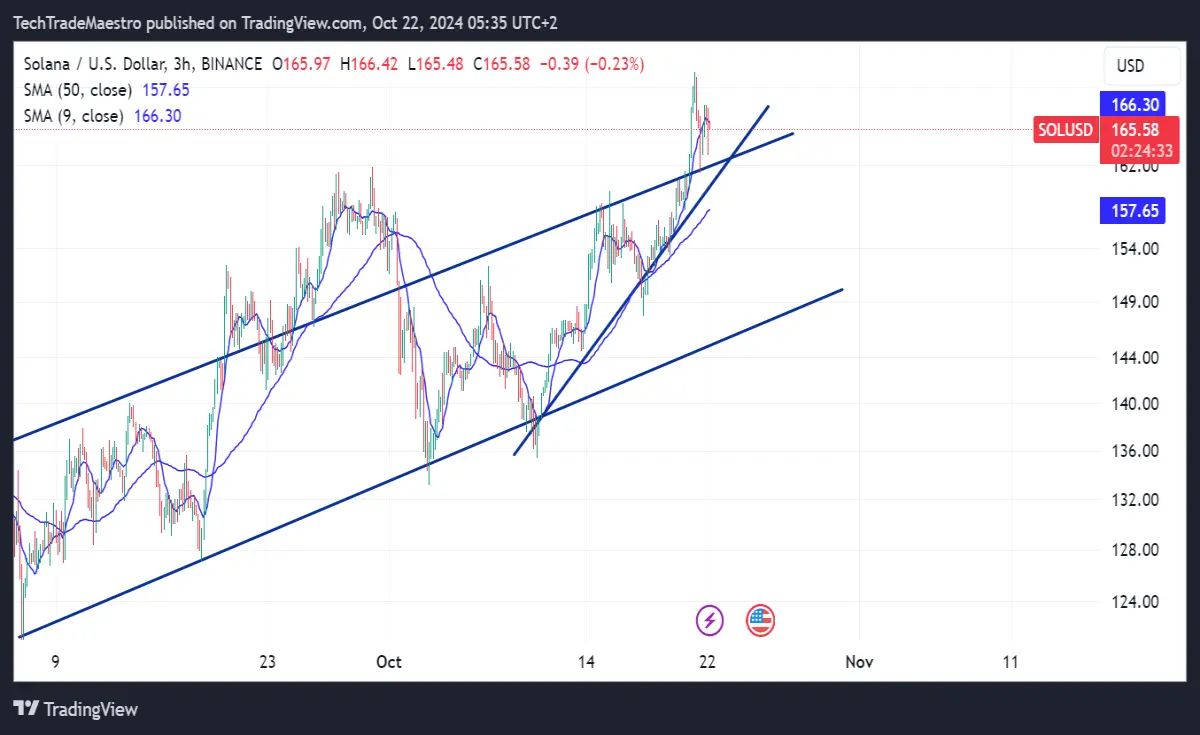
The first reason is the cyan line crossing the critical $161 level, indicating strong buying pressure. This threshold often acts as a psychological barrier, and its breakout can trigger further price increases.
The second key indicator is the SMA (Simple Moving Average) crossing the convergence level, signaling a potential continuation of the upward trend. This crossover suggests positive momentum ahead.
Overall, the current technical picture suggests further growth, and investors should watch closely to see if Solana maintains this momentum in the coming days.






