
After a brief pause, we’re back to monitoring the PEPE/USDC pair, which has been showing signs of growth. Last month, PEPE touched its second support level at 640, marking a significant low point. Since then, the price has been steadily climbing, moving into an upward trend.
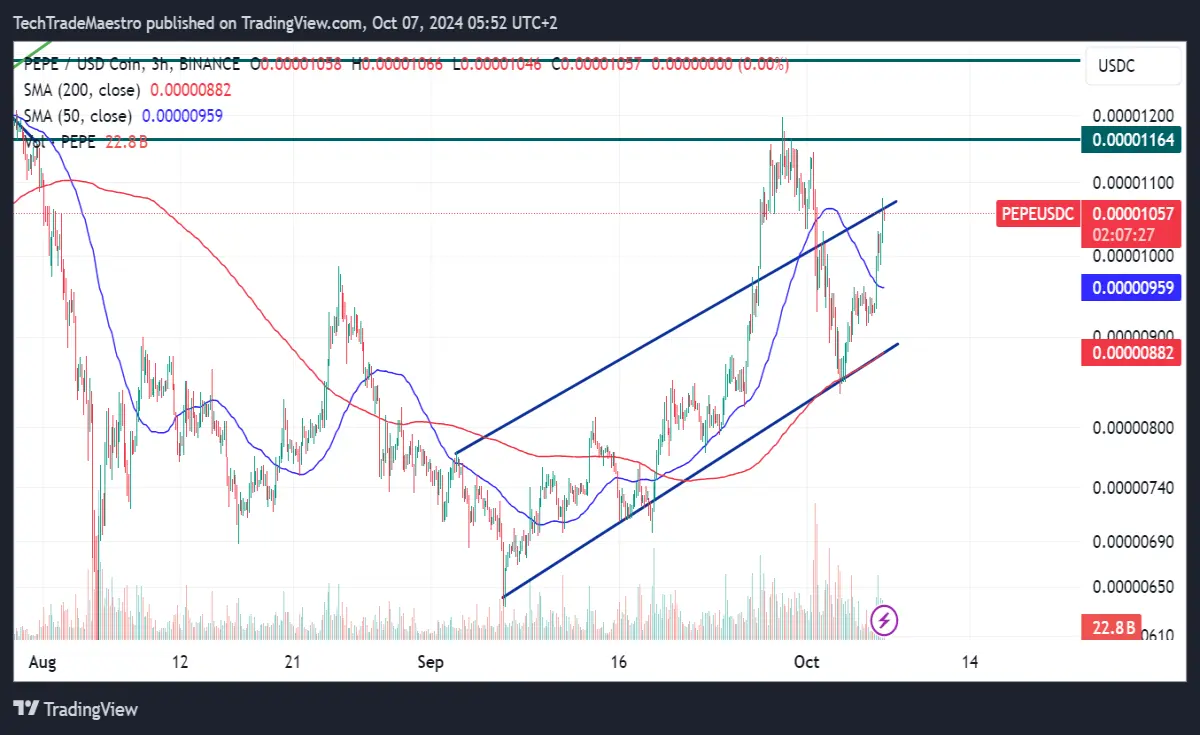
Currently, PEPE is testing its first key resistance level at 1165, which will serve as an indicator of whether this rise is sustainable. If PEPE manages to break through and hold above this level, we may see the trend continue toward higher levels, boosting investor confidence further.
Today, we are focusing exclusively on technical parameters that provide a clearer insight into the price movement. At the time of writing, PEPE's market capitalization stands at €4,041,420,539, reflecting significant investor interest and market support. We’ll keep an eye on price action to see if PEPE can withstand the challenges posed by the upcoming resistance levels.






