
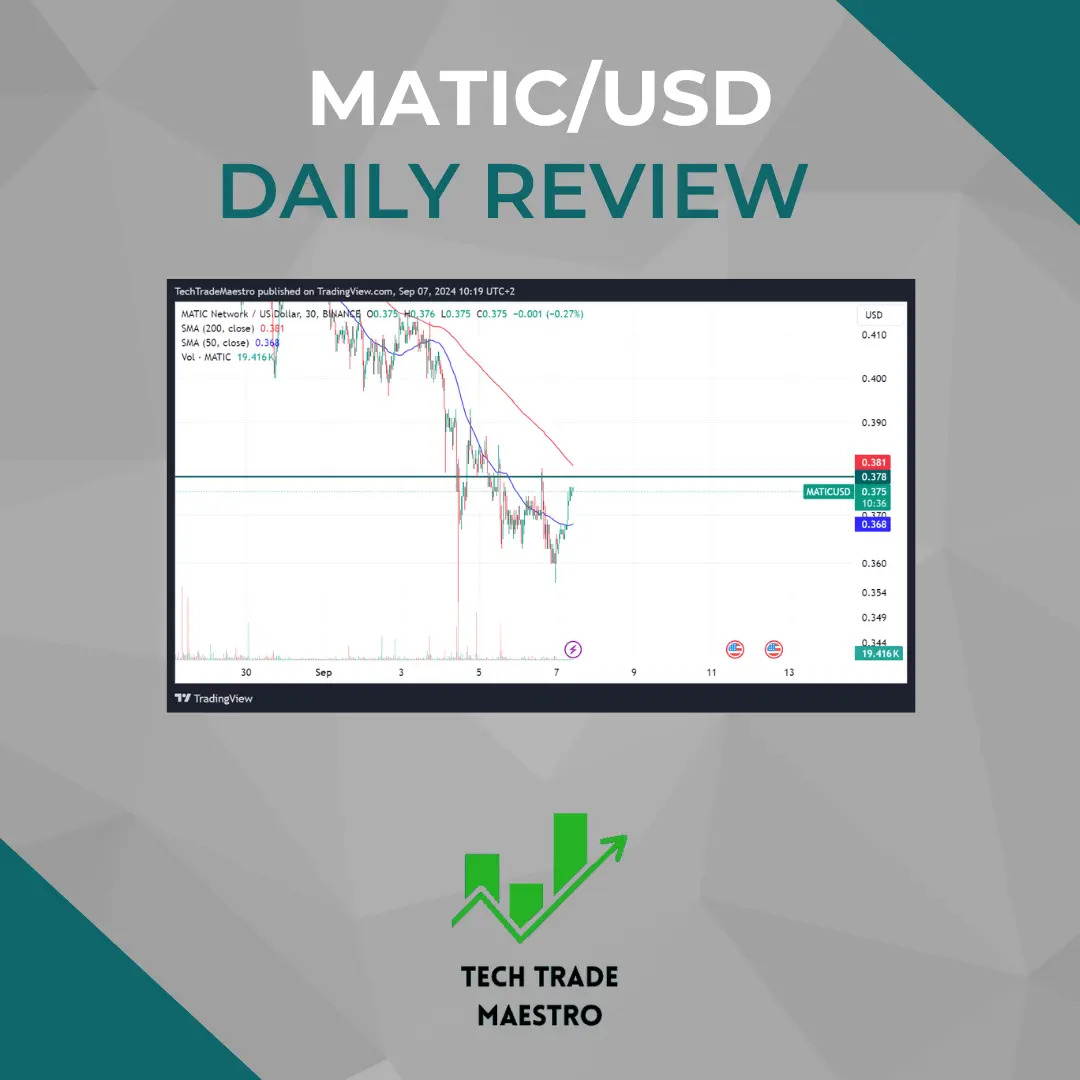
Today, we are observing MATIC, which, like other cryptocurrencies, has been in a downward trend, but there are signs of potential reversals on the horizon. Currently, we are closely watching a possible breakout at the $0.37 level, which would be highly positive for this token. If this level is breached, it could establish a solid support line, paving the way for further growth. It's important to note that the last time MATIC's price was this low was around August 24th, signaling an approach to a key reversal point.
Considering the Fear Index from CoinMarketCap, we can conclude that this support line in MATIC could represent a significant opportunity for smaller traders. These traders often capitalize on short-term dips to better position themselves for the anticipated future market growth. With increasing market volatility, moves like this can provide stability and a strong foundation for long-term strategies.
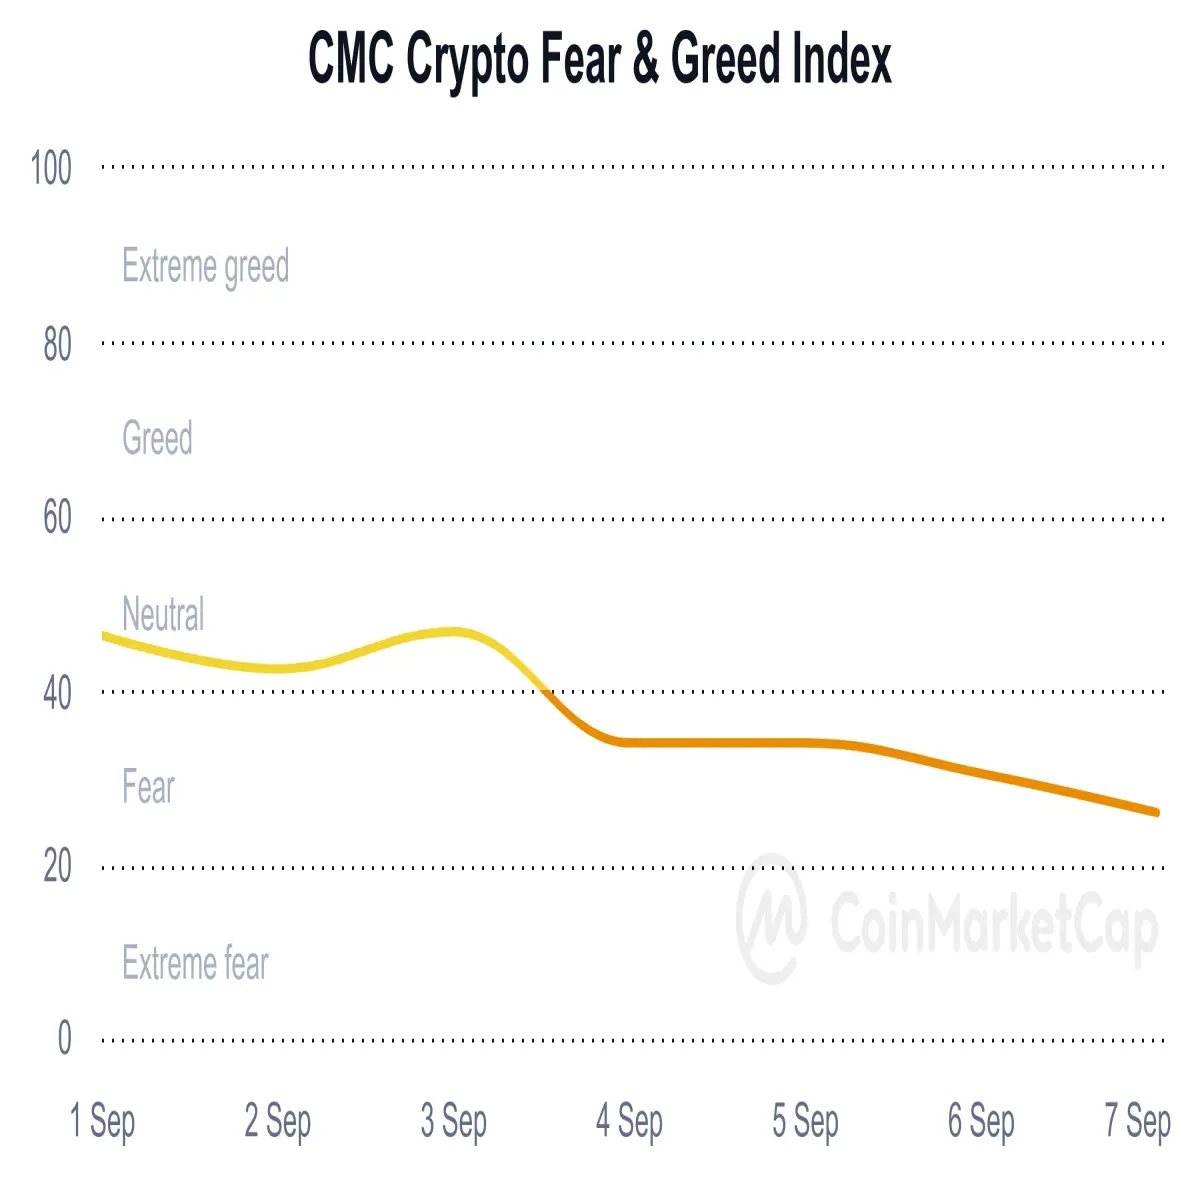
A brief introduction to the Fear Index:
When the index value is closer to zero, the market is in a state of extreme fear, indicating that investors are under pressure and irrationally selling off their assets. On the other hand, when the index value is closer to 100, the market is in a state of extreme greed, which often signals a likely market correction. CoinMarketCap uses a combination of price and trading data from the most popular cryptocurrencies, along with unique user behavior data, to accurately reflect the current sentiment in the crypto market.
Disclaimer: The analysis is for informational purposes only. All data is written in good faith and does not exclude investors from conducting their own analysis. The author of this text is not responsible for any losses incurred as a result of interpreting the published information. Trading currencies, stocks, and other financial derivatives involves high risk, and there is a possibility of losing your entire deposit. It is important to understand the risks before starting trading. All rights to the content and charts from the analysis are reserved by the owner, TechTradeMaestro. Further distribution of the analysis or use of its individual parts is only possible with prior approval from the content author.






