
n the world of cryptocurrencies, where declines have been common these days, Mantle (MNT) shows potential signs of a trend reversal. Let's analyze the current situation and what we might expect in the near future.
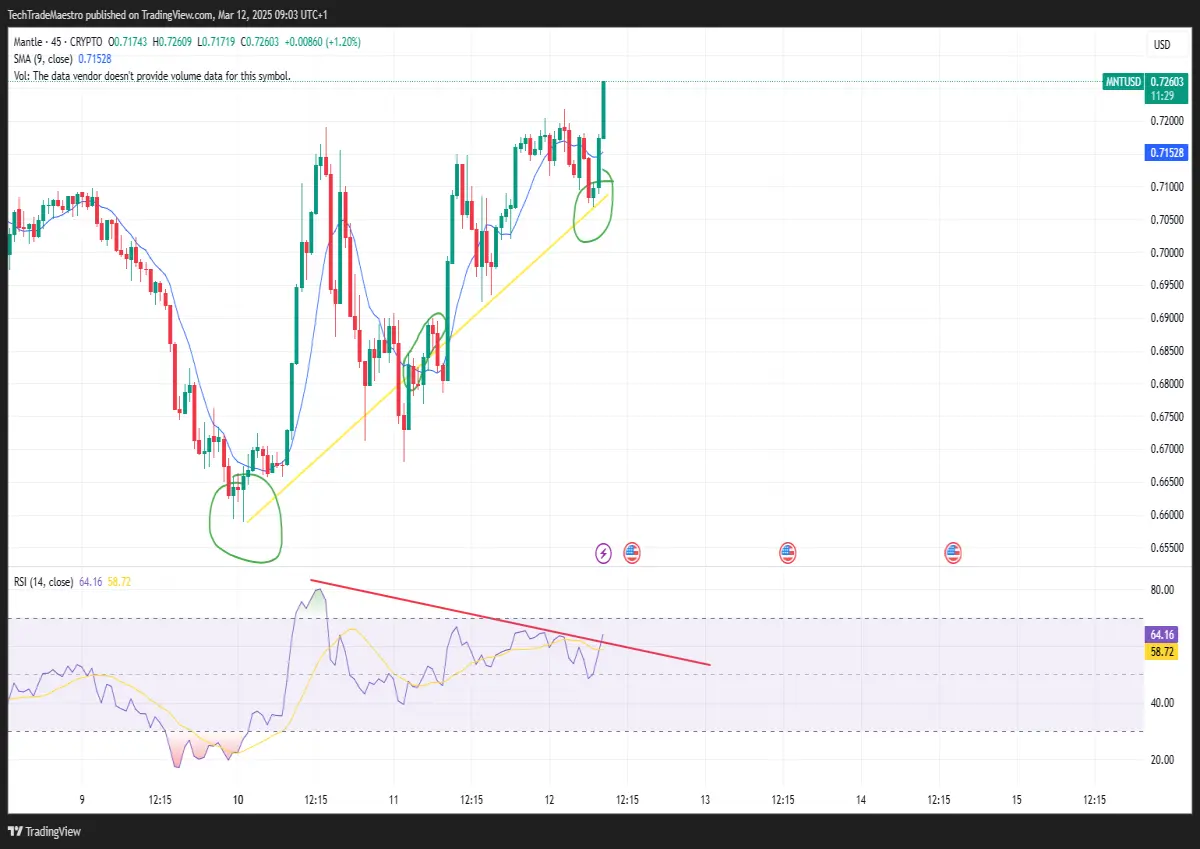
Chart Analysis
Observing the Mantle (MNT) price chart over the past week, we can see that the price hit a bottom on March 10th. Since then, a gradual rise has been noted, showing signs of stabilization and potential trend reversal despite some fluctuations.
Interestingly, the price followed the yellow trend line; however, around March 11th, it fell below it. This change may indicate a short-term correction, which is natural during the recovery phase after significant drops.
Indicators and Expectations
One of the key indicators in this analysis is the RSI (Relative Strength Index), which is still relatively high but gradually declining. This situation might suggest a slight correction before continuing the upward movement, which is common after a sudden price jump.
Conclusion
Current data indicates a potential continuation of growth after a brief correction. For investors monitoring Mantle (MNT), caution is advised, as well as careful tracking of key support and resistance levels. If the trend reverses, it could present a good entry opportunity.
Stay tuned for further analyses and be prepared for rapid market changes!
Support my work BTC: 1HtuYsFXc3zSBb8asZbFunrJJAKkn2dzxW
My Instagram: https://www.instagram.com/tech_trade_maestro/






