
Hi folks,
In this next tutorial, I am excited to say we'll be going over how to make a candlestick plot of our price data!
We'll cover:
- What is a candlestick chart
- How to select a sub-section of our price data
- How to create a candlestick plot of the selected data
What Is A Candlestick Chart
Originally developed in Japan, candlestick charting is a means to display the movement of stock prices visually. If you don't know what a candlestick chart looks like, here is an example:
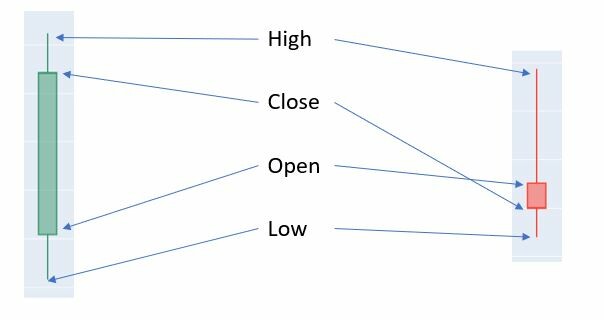
A candlestick consists of the following components:
- Opening price
- Closing price
- Highest price
- Lowest price
- Colour component (green or red)
If a candlestick is green, it means the closing price was higher than the opening price (stock went up in value). If it is coloured red, then the closing price was lower than the opening price (stock went down in value).
What is interesting is the patterns that the bodies (Open and Close) and the wicks (Highest and Lowest) prices make. Entire books have been written on candlestick patterns and analysis, and as I'm not an expert on them, I'll probably read one soon.
The main idea of plotting candlesticks is that specific patterns repeat or indicate stock movement, if you spot the trend early you can make a trade with greater confidence and accuracy, which should equate to more money in the long run.
With that brief explanation, let's look at the code to your own candlestick chart.
How To Select A Subsection Of Our Price Data
As usual, we'll read in our BTC data and create a pandas dataframe:
# Folder name of the directory where the data is stored
folder_name = 'Bitcoin_Historical_Data'
# Name of the csv file to load into a pandas dataframe
btc_daily = 'Coinbase_BTCUSD_d.csv'
# Join various path components
btc_daily_path = os.path.join(folder_name, btc_daily)
# Read in csv file data into pandas dataframe
btc_daily_df = pd.read_csv(btc_daily_path, skiprows=1)
# Convert the 'Date' column to datetime format
btc_daily_df['Date'] = pd.to_datetime(btc_daily_df['Date'])
# Set the 'Date' column as the index
btc_daily_df = btc_daily_df.set_index('Date')
Currently, we have all our price data in the dataframe, however, oftentimes we'll want to explore a subsection and to do that we can use a mask to filter the data.

A mask is simply a set of logical constraints for each row that evaluates as true or false, and when the mask is applied to the dataframe, only those rows that are true are returned.
Don't worry if that doesn't make a great deal of sense now, seeing it done will explain everything. Basically, I'm going to ask whether the date in the index column is between a start date and end date, and only the rows for which this is true will be returned:
# Create start and end dates using pd.to_datetime
start_date = datetime(day=1, month=12, year=2019)
end_date = datetime(day=31, month=12, year=2019)
# Create a mask based upon the start and end date
mask = (btc_daily_df.index >= start_date) & (btc_daily_df.index <= end_date)
Looking at the mask:
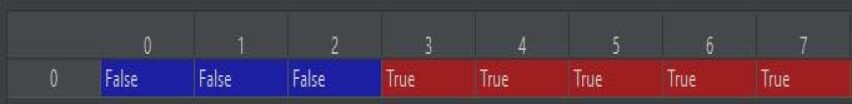
we see it is simply a series of true or false statements, and when this is applied to our dataframe, a new dataframe can be created consisting of only the rows where a true value in the mask was present:
# Apply the mask to select the specific subset of our data
last_month = btc_daily_df[mask]
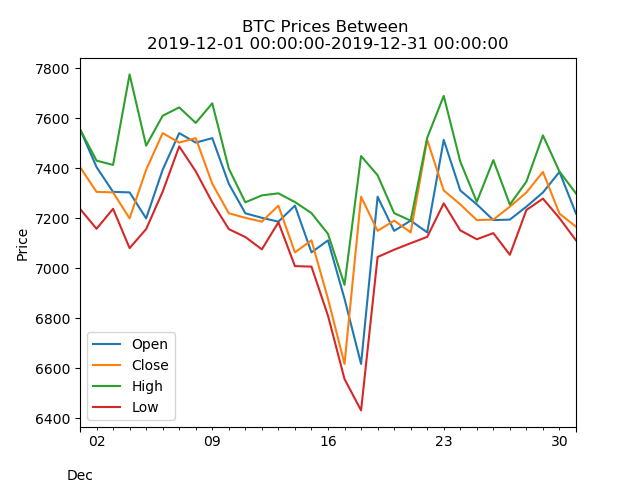
# Plot our last_month dataframe to see if contains only the data we want
last_month.plot(y=['Open', 'Close', 'High', 'Low'],
x='Date',
title="BTC Prices Between \n" + str(start_date) + "-" + str(end_date))
plt.ylabel('Price')
plt.xlabel('Date')
plt.show()
How To Create A Candlestick Plot
Awesome, we now have all of the price data from the last month of 2019 in a dataframe, though looking at the plot above it's quite hard to discern any noticeable patterns right away with all the lines overlapping. To reduce this visual noise we can convert the line plot into a candlestick plot:
# We've also reset the index, which has moved the 'Date' column back into the dataframe, as we will need these for the charting function.
last_month = last_month.reset_index()
import plotly.graph_objects as go
fig = go.Figure(data=[go.Candlestick(x=last_month['Date'],
open=last_month['Open'],
high=last_month['High'],
low=last_month['Low'],
close=last_month['Close'])])
fig.show()
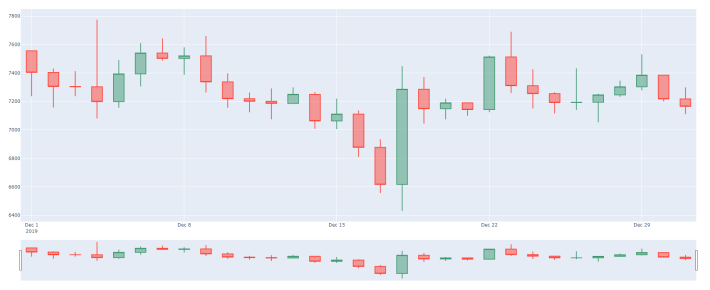
And there we have it, a beautiful candlestick plot. All I have to do now is learn how to interpret a candlestick plot and I will be able to divine the future stock movements and become a millionaire. Okay, maybe it's not that easy, but at least I can make pretty plots until I read up on candlestick charting.
As always, I hope you've enjoyed this quick tutorial and can begin applying candlestick charting to your own data analysis.


