
Today, I'll tell you my spot trading strategy. It is an elaboration of already existing trading strategy. This strategy is based on RSI (Relative Strength Index) indicator.
I'll work with KuCoin, but you can use any other exchange which supports RSI.
What is RSI?
RSI is a Relative Strength Index, which tells us if the cryptocurrency is overbought (it may be bearish in close future) or if it is oversold (it may be bullish in the future). When the RSI is lower than 30, it means that the currency is oversold. If the RSI is higher than 70, the currency is oversold.
It may look easy, but it isn't, because there are several secondary factors:
- RSI is good only for short-term investments (max. one week).
- The overbought and oversold values depends on the current crypto. Each crypto behaves differently.
- Due to market fluctuations, the RSI might move up or down without any bigger price move.
- RSI isn't 100% proof of rising or falling of the price.
Which time chart should you choose?
I personally prefer to use one hour chart, but the 15 min, 30 min and 2 or 4 hours chart could be also useful.
Before making any investment I recommend to look at the daily chart if the potential of the crypto is bullish or bearish or it only fluctuates around the same price. You logically should use the bullish or fluctuating cryptocurrency.
How much of your capital you should use?
I recommend to use maximally 5% of your real-life capital, because due to market volatility, you can lose everything.
When buying crypto with this strategy, use only ¼ of your crypto portfolio. If the price falls after your investment, you can invest another ¼ and the price of take profit will be lowered.
When you are new in this strategy, don't use much money. Trade with only about 10 USDT and just try it and learn how the market works.
When buy and when sell?
The general point where to buy is, when the RSI crosses below 30. However, I recommend to look at the chart of your crypto first and look which RSI it has in the dip. Find the lowest RSI values in 1 hour chart in two or three days before. I recommend you to use these lowest values + 5, to be the most effective with your trading.
Before selecting any crypto to buy, look at the daily chart. If the chart is bearish for more than two weeks, don't use this crypto for this style of trading.
The general point where to sell is, when the RSI rises above 70, but it also depends on the chart. I'll speak about that later in this post. My general point where to sell depends on the current situation.
In the next part I'll show you some basic market movements from which I decide if sell now or later.
Basic market movements
Up-Fluctuating RSI sabotage:
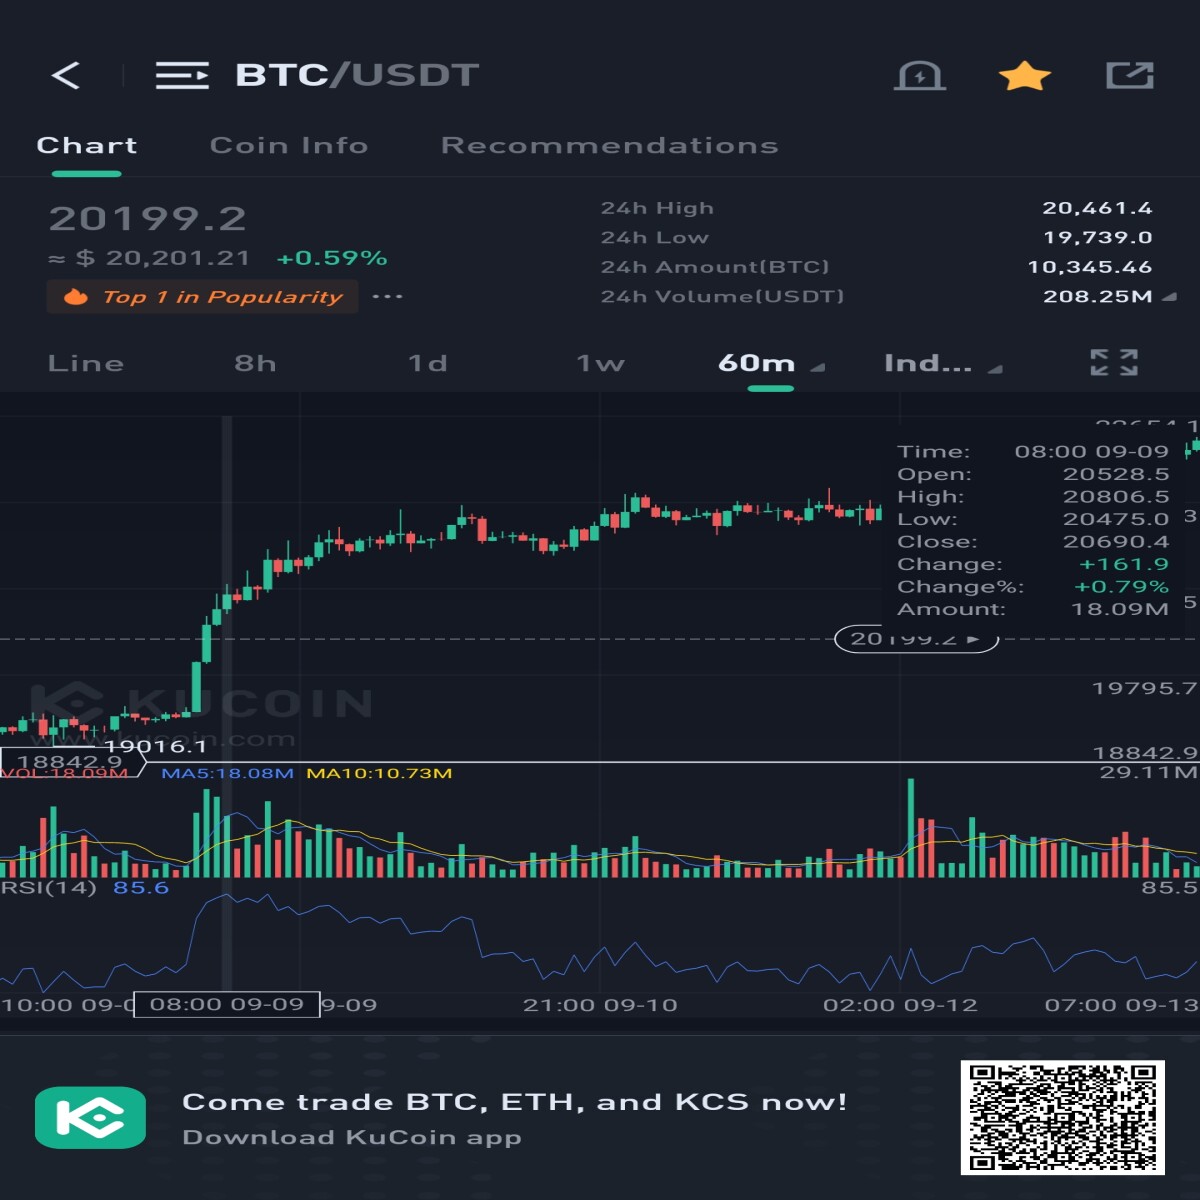
On this chart you can see that the RSI is in the overbought zone, but the price isn't going down. You may ask:
What is happening?
Because RSI is a time-based indicator, if the price goes up to the overbought zone and then shortly fall and then recovers, the RSI gets down, below the overbought zone.
What can you do?
If you don't use futures trading or margin trading, where you risk liquidation of your assets, don't worry, the price will fall, but after longer time than normally.
Down-Fluctating RSI sabotage:
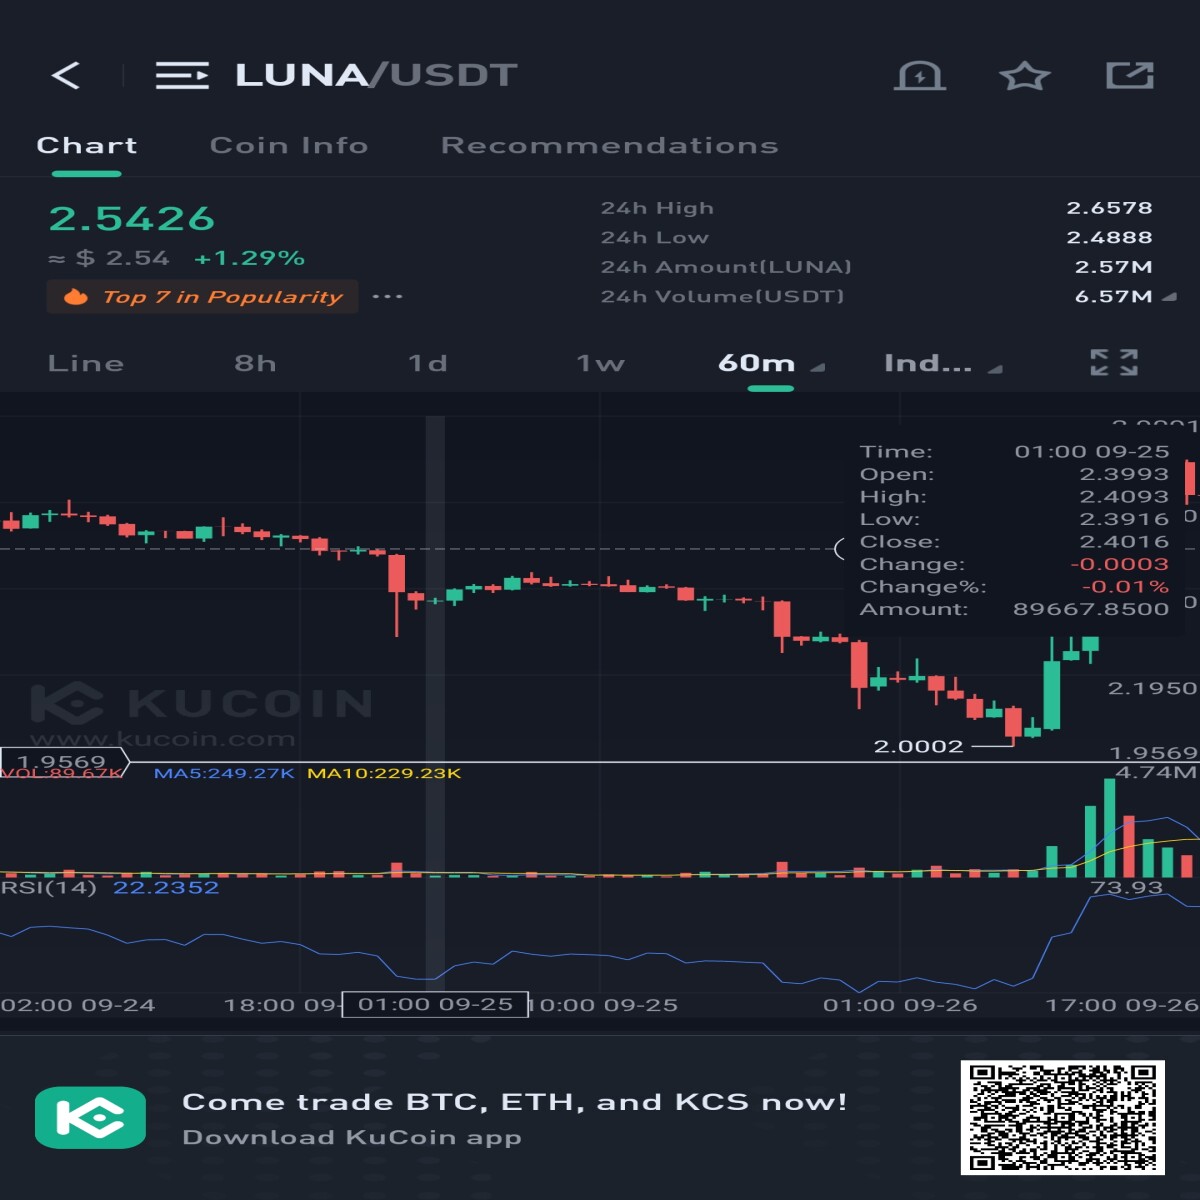
As you may see on the chart, the RSI is going deep into the oversold zone, but then, the price rises for less than 1% and the RSI recovers to 40 to 50.
What happened?
This is like from the first example, due to small market fluctuations and due to fact that RSI is time-based indicator, its value may rise, despite the price falls.
What can you do?
Just hold and probably, you can buy more to increase your profit.
RSI trader's dream chart:

As you probably see in the picture, if you use the strategies which I described above in this chart, you will be in a profit in about 5 hours after making an investment.
Crazy crypto bullish:
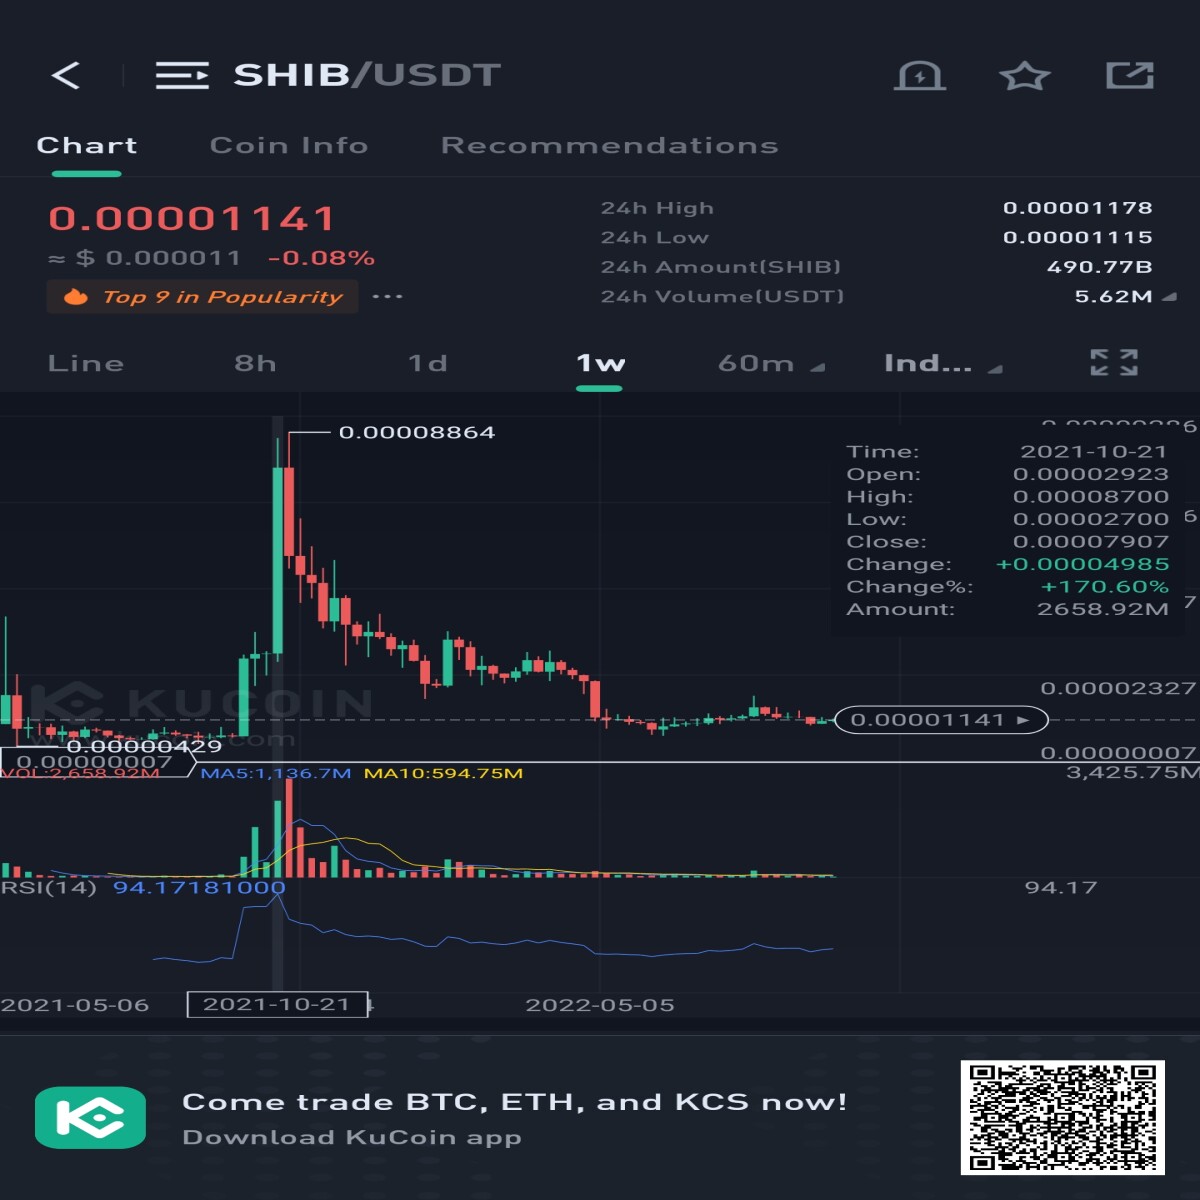
Sometimes, the people get crazy and buy despite the price is lots of millions percent up. This it the only reason why is futures short dangerous.
These charts are really rare. You will probably see only units of cases when RSI rose above 94.
When sell?
I usually take the profit when it reaches about 1 to 2%. I recommend to set a realistic sell price. However, I look at the chart some times per day and if I see the "Down-Fluctating RSI sabotage", I will lower my profit requirements to about 0.5%. If the price falls, don't sell! You will regret this hasty decision later. If the price fell down and is down for some days, you should probably invest more and lower your take profit price.
The basic rule of spot trading is, don't sell while you are in a loss.
That was everything from me, and please note that I am not an financial advice. Remember to do your own research before investing.


