Most of the time, we do long researches for auxiliary tools that we will use for patterns, oscillators, indicators, etc. But at the end of the research, we have no information that we can use.
In this series of articles, I will describe a simplified language and simplified trade.
Will be constantly updated..
TREND LINES.:
Trend lines are lines that connect at least three points, act as support and resistance and provide information about the end or continuation of the trend.* The lines on the train must connect at least three points.
* Selected points should not be too close or far away. (a few lines apart)
* The more points the trend lines touch, the stronger the trend.
* How long the trend line can continue without breaking. The trend is so strong.
* Downtrend lines are always drawn under price bars.
* Uptrend lines are always drawn on price bars.
* The instant break of the trend line does not show that the trend has changed permanently.
* If the trend line is drawn at a low angle, there is no trend and the market is moving horizontally.
* If the trend line has a sharp angle, there is oversold trading in the market, the trendline is not safe.
* When connecting train points, they should not cut other price bars.* Short-term traders are based on several weeks of trend.
* Long-term investors are based on monthly and yearly trend.* In the uptrends, the trend line acts as a support. As the price approaches the trend line, purchases are made. If the trend breaks, the position is closed.
* In the downtrends, the trend line acts as resistance. Sales are made as the price approaches the trend line. If the trend breaks, the position is closed.The trend line may have been violated;
> According to the size of the price bar
> By trading volume
> By daily and hourly closing
''Support is a price level where a downtrend can be expected to pause due to a concentration of demand.''
''Resistance is a resistance zones arise due to a sell-off when prices increase.''
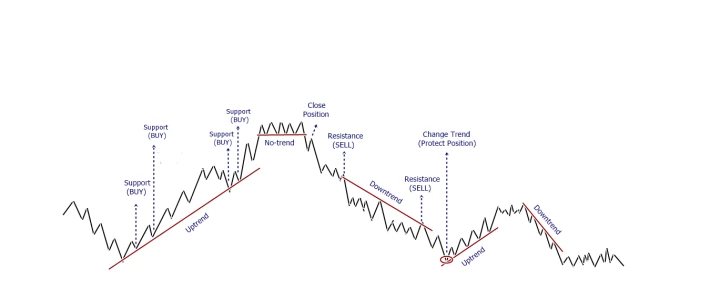
Trend Lines
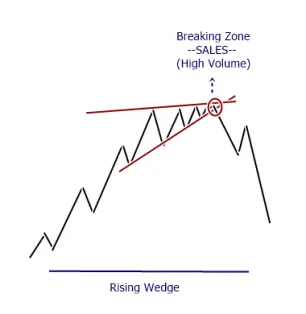
RISING WEDGE PATTERN.:
*It is a top-turn formation.
*Gives an image that can be elevated.
*As this formation occurs, the trend gives a strong slope.
*You need to track the volume to find the sales zone.
*In general, the volume is high.
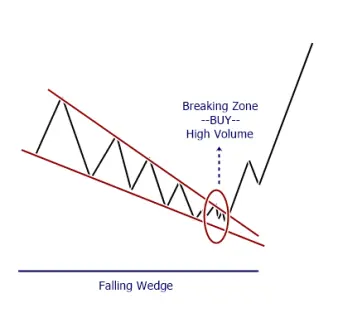
FALLING WEDGE PATTERN.:
*It is an uplift formation.
*Image gives the image of falling.
*However, with volume, there is a strong rise in the first attack.
*The secure receive zone is on the falling channel.
*Volume movement is very important.
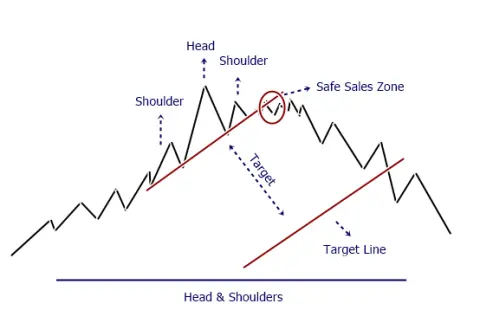
HEAD & SHOULDERS PATTERN .:
*Reports the end of the rising trend.
*For a safe sales area, volume growth is crucial.
*The target after breaking is the distance between the head and shoulder.
*This distance is added and calculated under the shoulder(support).
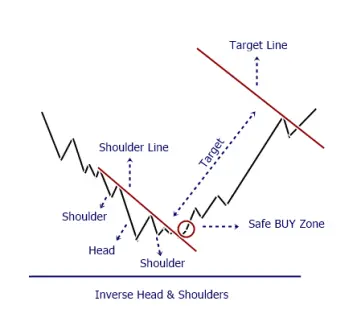
INVERSE HEAD & SHOULDERS PATTERN .:
*Reports that an end of a falling trend is coming.
*Provides safe results when formed in bottom areas.
*Volume movements are monitored for safe safe zone.
*The volume is expected to increase.
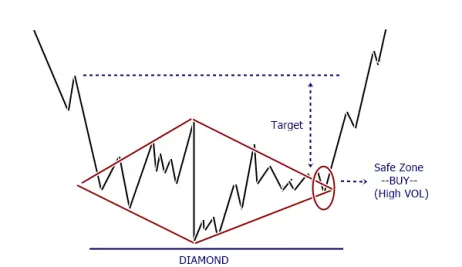
DIAMOND PATTERN .:
*This formation indicates that the bottom formation is about to end.
*What is important here is not to grab the tokens during inconsistent movements. In this formation, the volume decreases towards the support and the volume increases towards the resistance. The secure buy zone is resistant to high volume refraction.*If the diamond formation occurs on the hill, it reports the return from the hill and is dangerous.
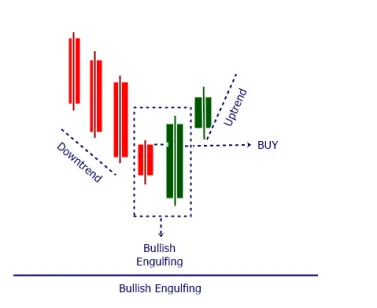
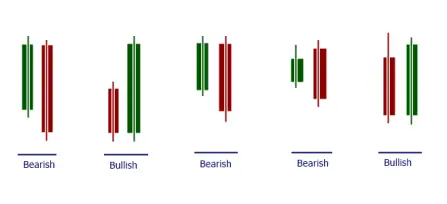
BULLISH ENGULFING PATTERN.:
*The primary rule for this is that the token is in a downward trend.
*This formation consists of two candles.
* In the downtrend, the first candle must be bearish and the second candle must be bullish.
* The green candle that is opened after the red candle that comes with the downtrend must swallow the red candle that preceded. it together with the needles.
* For formation confirmation, the third candle opened is expected to close green.
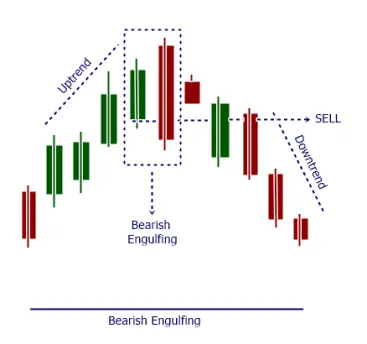
BEARISH ENGULFING PATTERN.:
*The primary rule for this is that the coin is in an upward trend.
*In this formation, the first candle in the upward trend should be green and the second candle should be red.
*The red candle that opens after the green candle that comes with the upward trend must swallow the previous green candle with the needles.
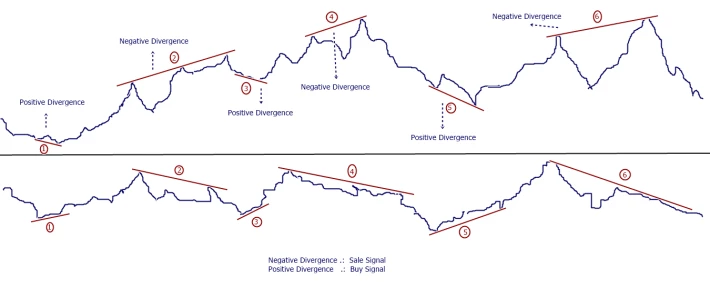
NEGATIVE & POSITIVE DIVERGENCE.:
In general, the price is in harmony with the indicator.*If the indicator falls while the price goes up, it is a Negative Divergence.
*If the indicator goes up while the price goes down, it is a Positive Divergence.
Negative Divergence : Sale Signal
Positive Divergence : Buy Signal
STOCHASTIC OSCILLATOR.:
*Below 20; If the red line intersects the blue line upwards, BUY
*Over 80; If the red line intersects the blue line downwards, SELL
RELATIVE STRENGTH INDEX RSI.:
The RSI indicator has two limits, 30 and 70.
* 30 and below is the oversold zone.
* The zone 70 and above is the over-reception zone.The up and down movements of the 30 and 70 limits are trade signals.
* If the line 30 cuts upwards, it is the BUY signal.
* If the line 70 cuts down, it is the SALE signal.50 limit is the market equilibrium. position is taken towards the direction of movement of the line.
If prices are similar with RSI, the direction of the price will be confirmed.
PARABOLIC STOP & REVERSE (PSAR) .:
* If the PSAR indicator points are above the price, it is the BEAR signal.
* If the PSAR indicator points are below the price, it is the BULL signal.* Dots below the price, if the price exceeds the signal to sell.
* Points above the price, below the price is the signal to buy.* The fact that the points are far from each other indicates that the trend is strong.
* The fact that the points are close to each other indicates that the trend is weak.
MOVING AVERAGE CONVERGENCE DIVERGENCE (MACD).:
* If the MACD line (blue) is above the signal line (red), a positive trend prevails, and below it a negative trend.
* If the MACD line (blue) turns down and crosses the signal line (red) down in the positive zone, it is the SALE signal.
* If the MACD line (blue) turns upwards and intersects the signal line (red) upwards in the negative zone, it is the BUY signal.






