HTF majors look a bit topped out like BTC. I personally think they have been in distribution as the first option , or in a complex re-accumulation model. I personally think distribution . So this is an analysis what levels to look at if BTC corrects the 20-40% most expect . In a bull run usually there is an initially correction of such percentage . The video will clarify what exactly I am looking at and the levels to look for entries.
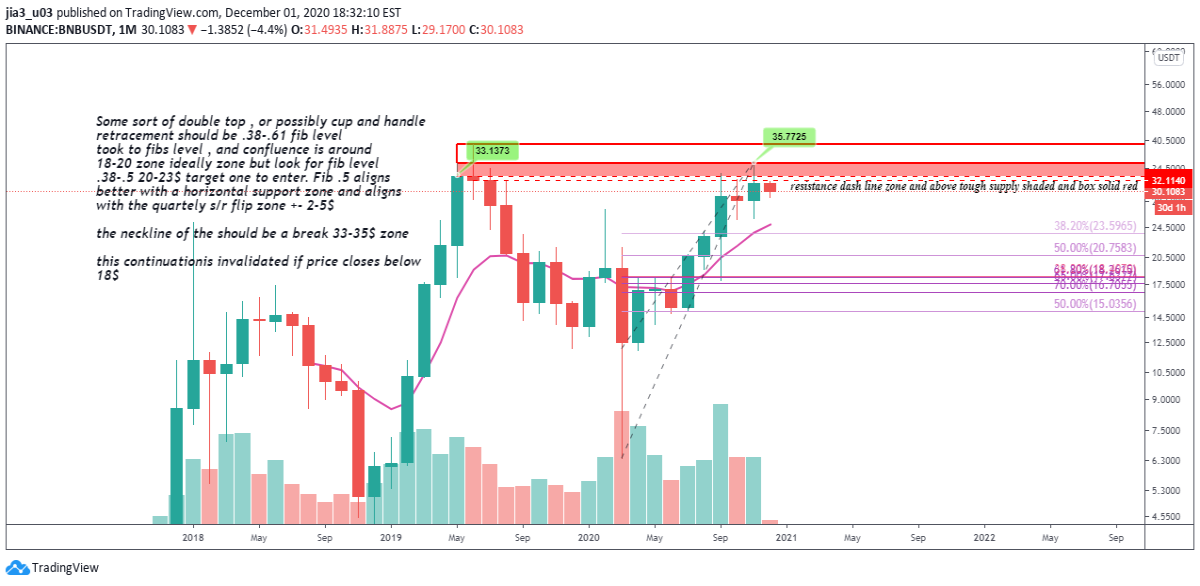
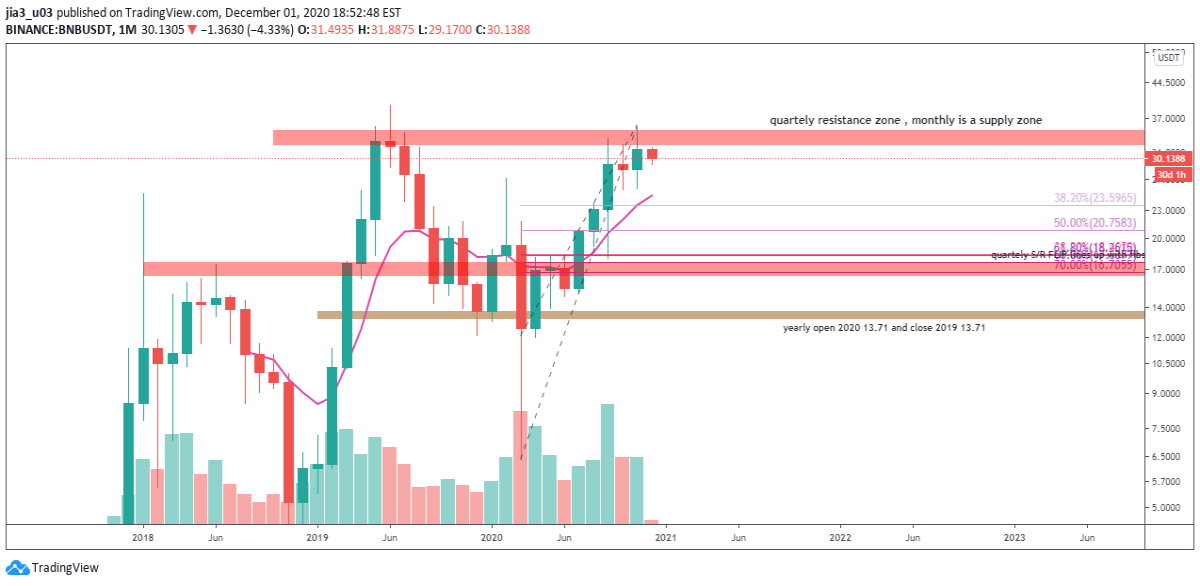
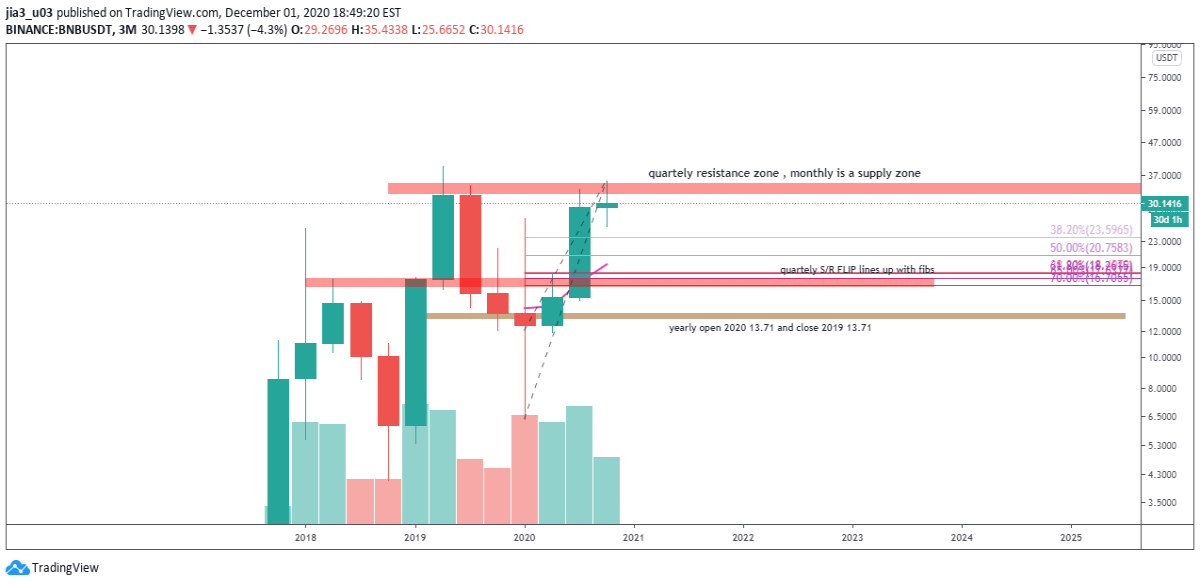
Possible re-entries for BNB is this is a real bull run . 20-23$ dollar zone. Sort of a double top daily . (Read charts notes please) . I have included charts of fib retracement zones that align with demand zone. One level that I like is the 20-22 zone that aligns between fibs , .38/.50. The monthly PA aligns well with these fibs levels and demand zone, in traditional market price in an uptrend should not pull back more than .23 fib , crypto .38-.5 at best .5 fib.
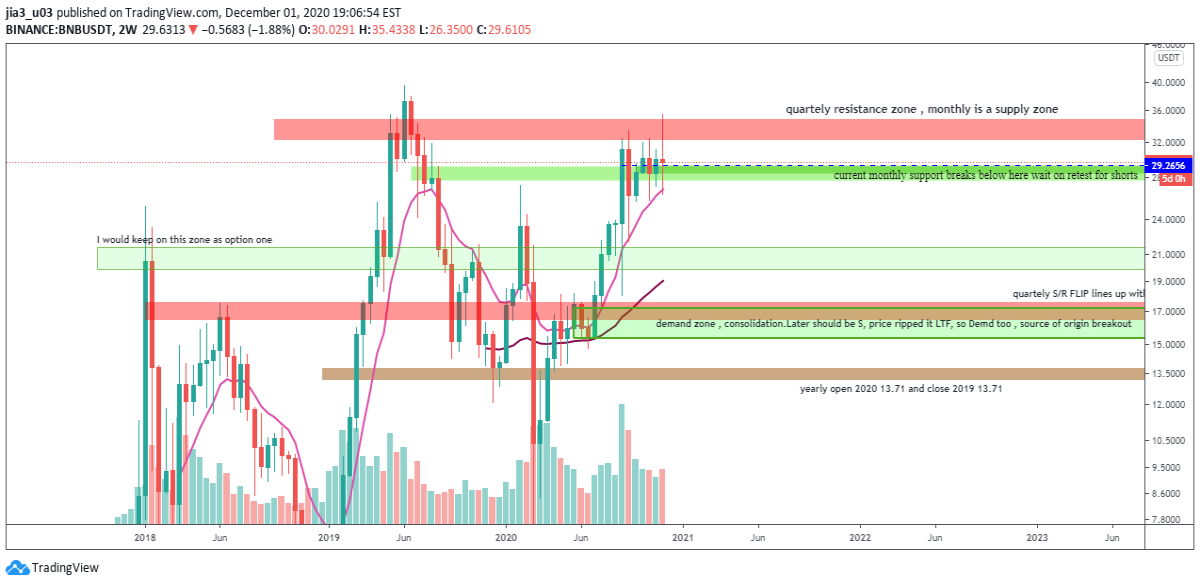
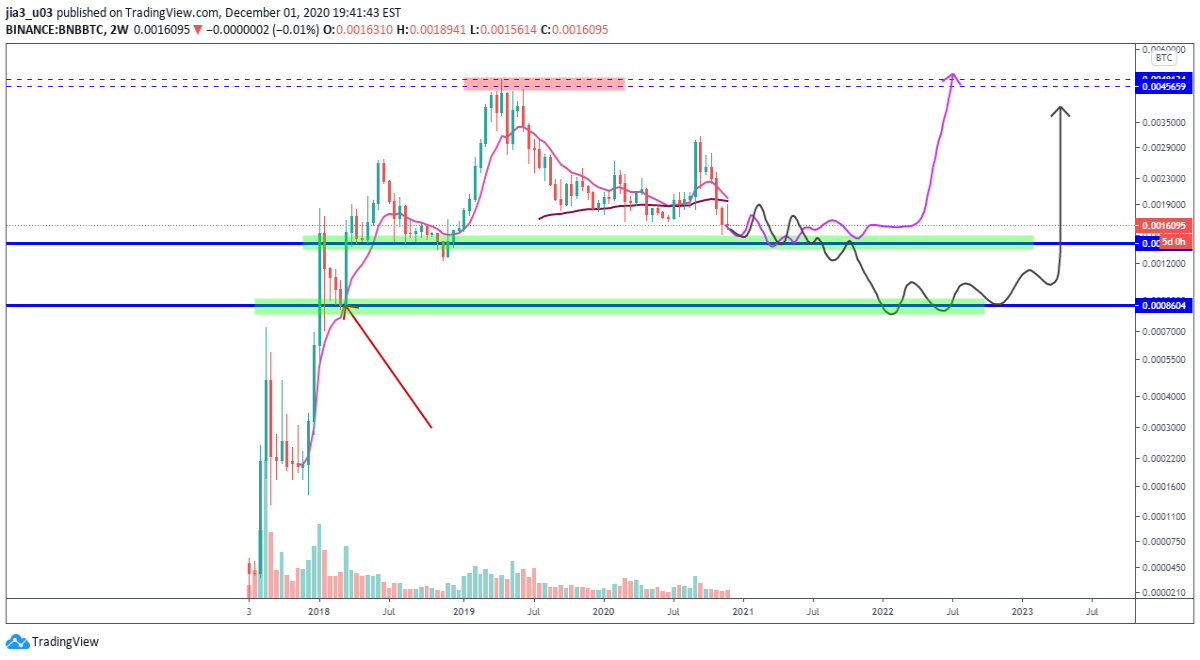
PA in the monthly when looking at a blank chart seems like possible cup and handle play. The two weeks chart showing signs of tops , PA moving sideays while failing make new highs while indicators going downward .