DAX two analyzes

DAX two analyzes


DAX30

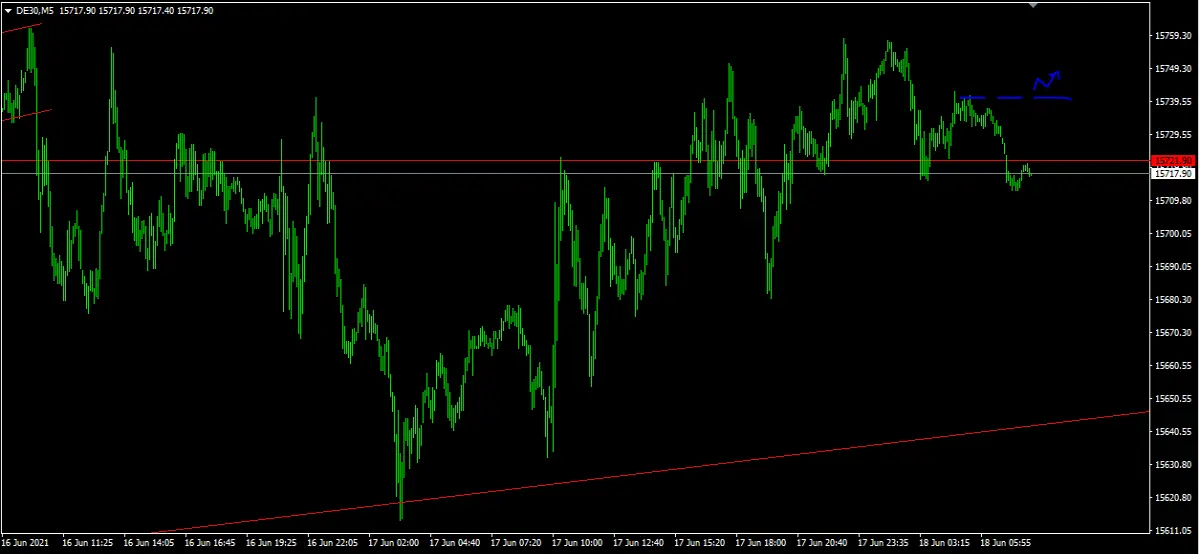
The first time interval we will deal with will be M5, after which you can see that the price may drop. The place I marked with a dotted line indicates the level at which I will enter the long position. Of course, I start the trading session in an hour, i.e. at 8 European time, so it may still change a bit during this time. If the price does not break the marked level, I will look for short positions after opening the session.

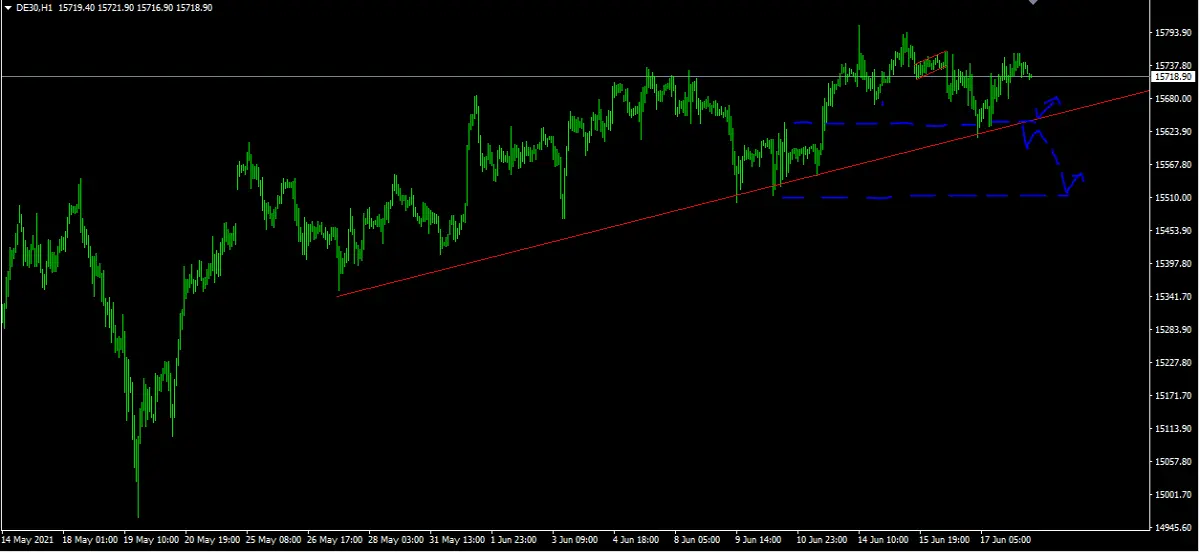
In the second image I have marked exactly what I am considering in the time interval H1. Until the price is above the trend line, for me there is an uptrend all the time, and I take this position into account. The border of the line coincides with the support and in the event of a correction, I will expect a rebound there. If the support turns out to be too weak, the second scenario is indicated below in the same way.
dax

DAX H1

How do you rate this article?

5


Biznes-Broker
Biznes-Broker

Trader, cryptocurrency and forex market analyst. Editor of investor magazines: EN: http://biznes-broker.com/ PL: http://pvq.pl/ By giving me a tip you donate it to charity. All collected funds will help children and animals in need.


Analysis of the financial markets

Subjective view of the financial market. Mainly Forex, Indexes and Commodities. Analyzes based on technical analyzes. All analyzes are my view of the market. It is not recommended to make trading decisions based on the information provided. You can check my work here: EN: http://biznes-broker.com/ PL: http://pvq.pl/

Publish0x

Send a $0.01 microtip in crypto to the author, and earn yourself as you read!

20% to author / 80% to me.
We pay the tips from our rewards pool.


