There is some massive talk trending across the Web3 space right now regarding where the crypto market is headed next. A recent statement from White House adviser Patrick Witt caught everyone by surprise as he revealed that the government is actively pushing to get the Crypto Clarity Act officially passed by July 4th. Getting solid regulatory guidelines from the United States should technically be a massive milestone for digital assets since clear rules are exactly what institutional giants look for before deployment.

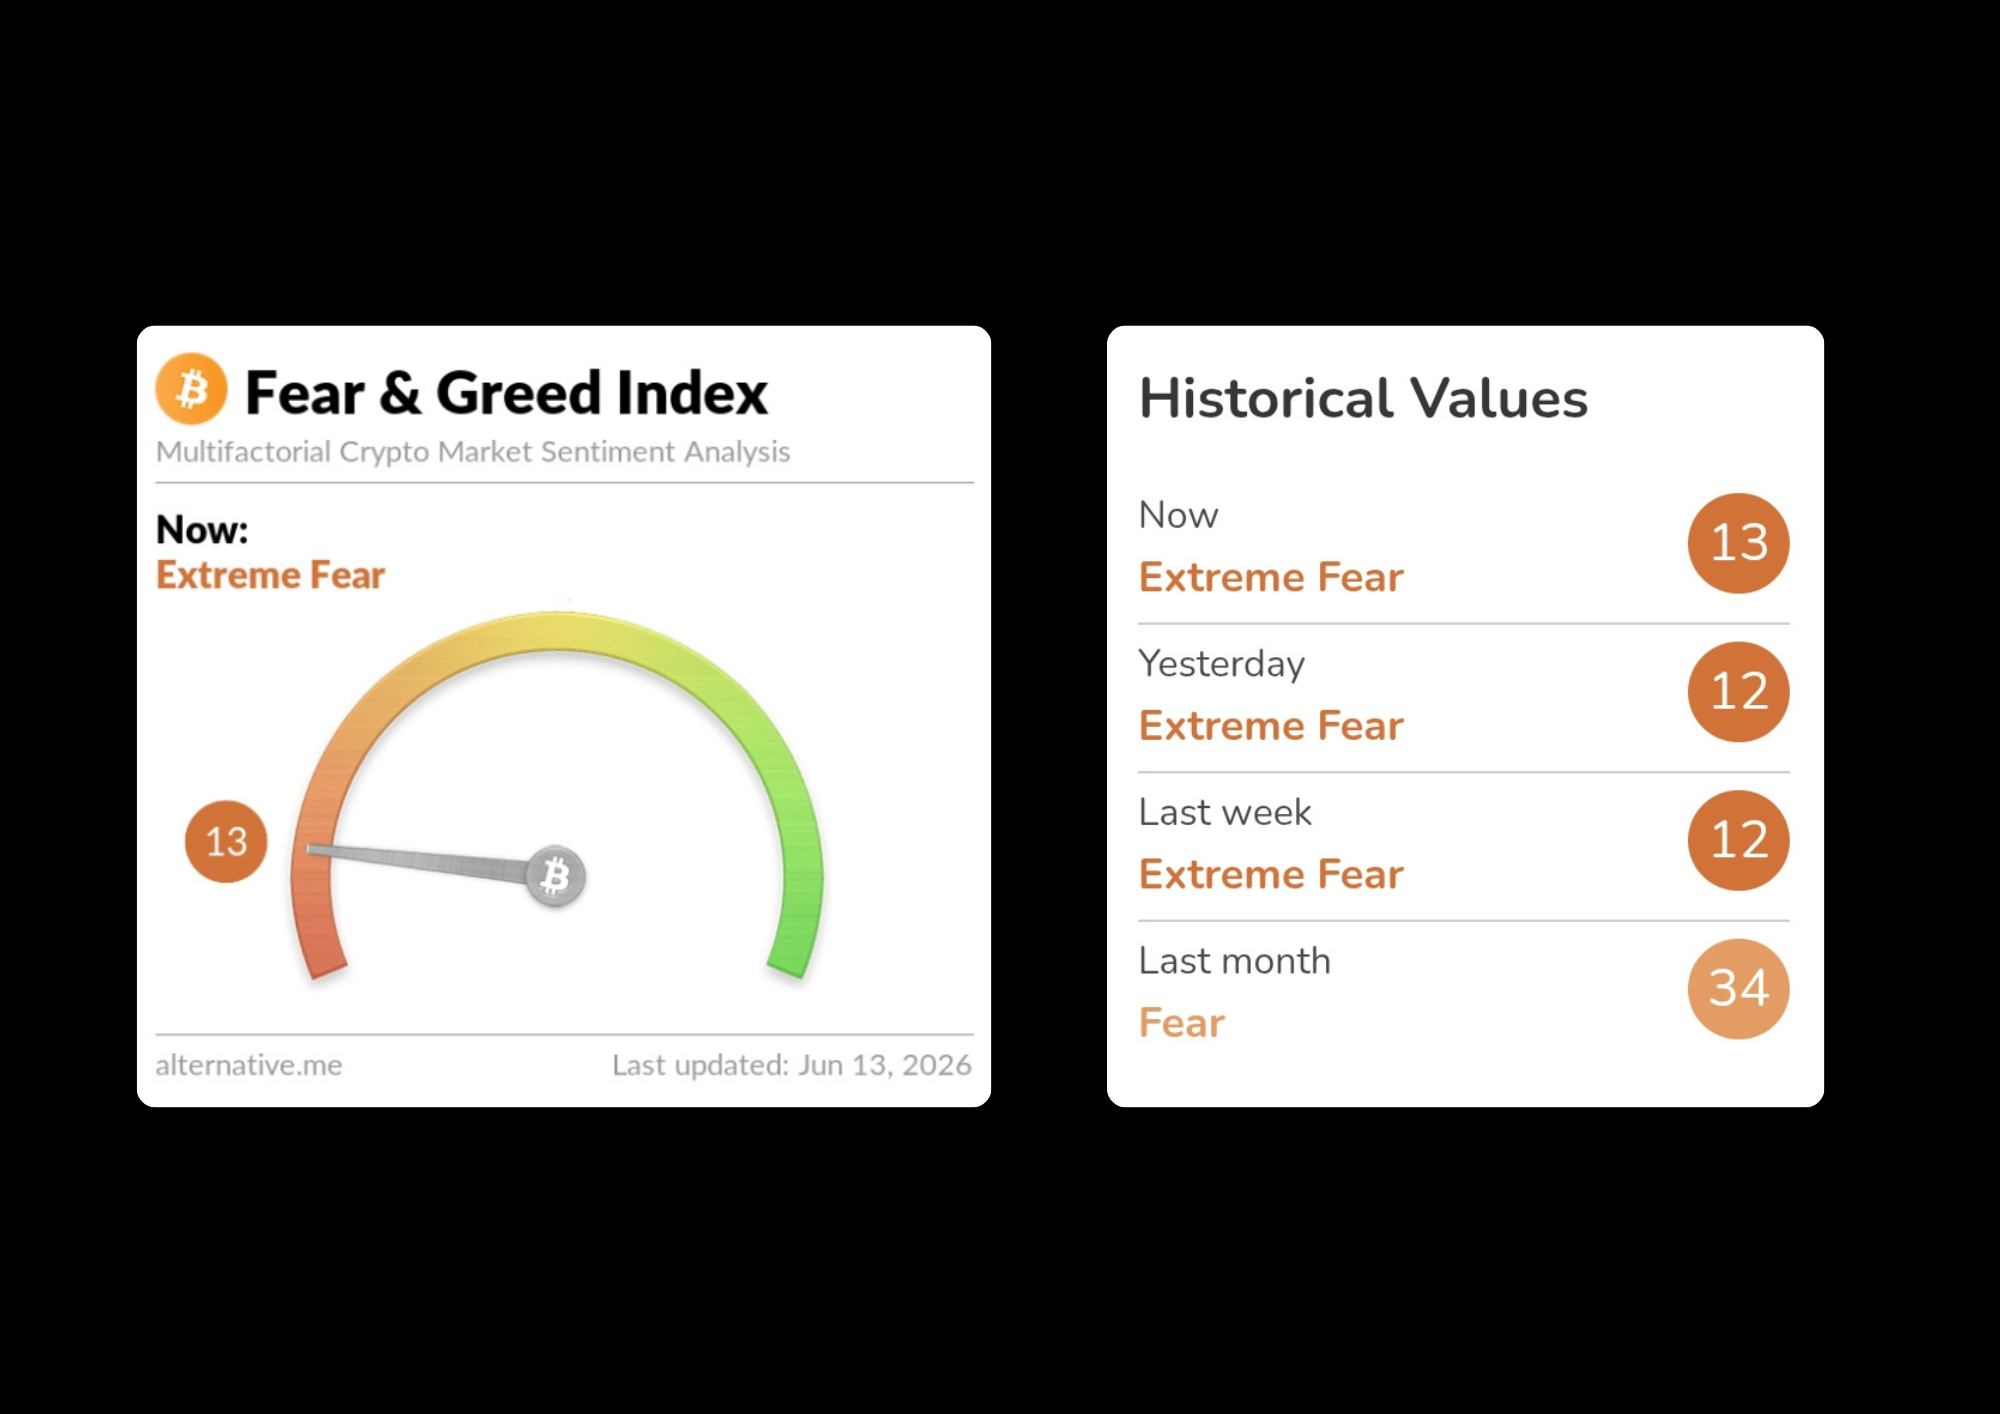
While this legislative news serves as an incredible long term fundamental catalyst, the short term market reaction is telling a completely different story. Instead of printing green candles, the broader trading community has plummeted straight into a state of panic selling. The retail fear gauge has tanked all the way down to a value of 13% on the sentiment tracker, signaling a state of Extreme Fear across the board.
This sudden wave of capitulation has triggered massive ripples across various leverage platforms. Looking at the derivatives dashboard, the volatile price swings have completely flushed out tens of millions of dollars in open positions, with aggressive short squeeze liquidations taking the brunt of the damage. Interestingly enough, even with the intense volatility, the total trading volume and liquidity pools remain heavily cornered by a tiny handful of elite platforms including Binance, OKX, and Bybit.
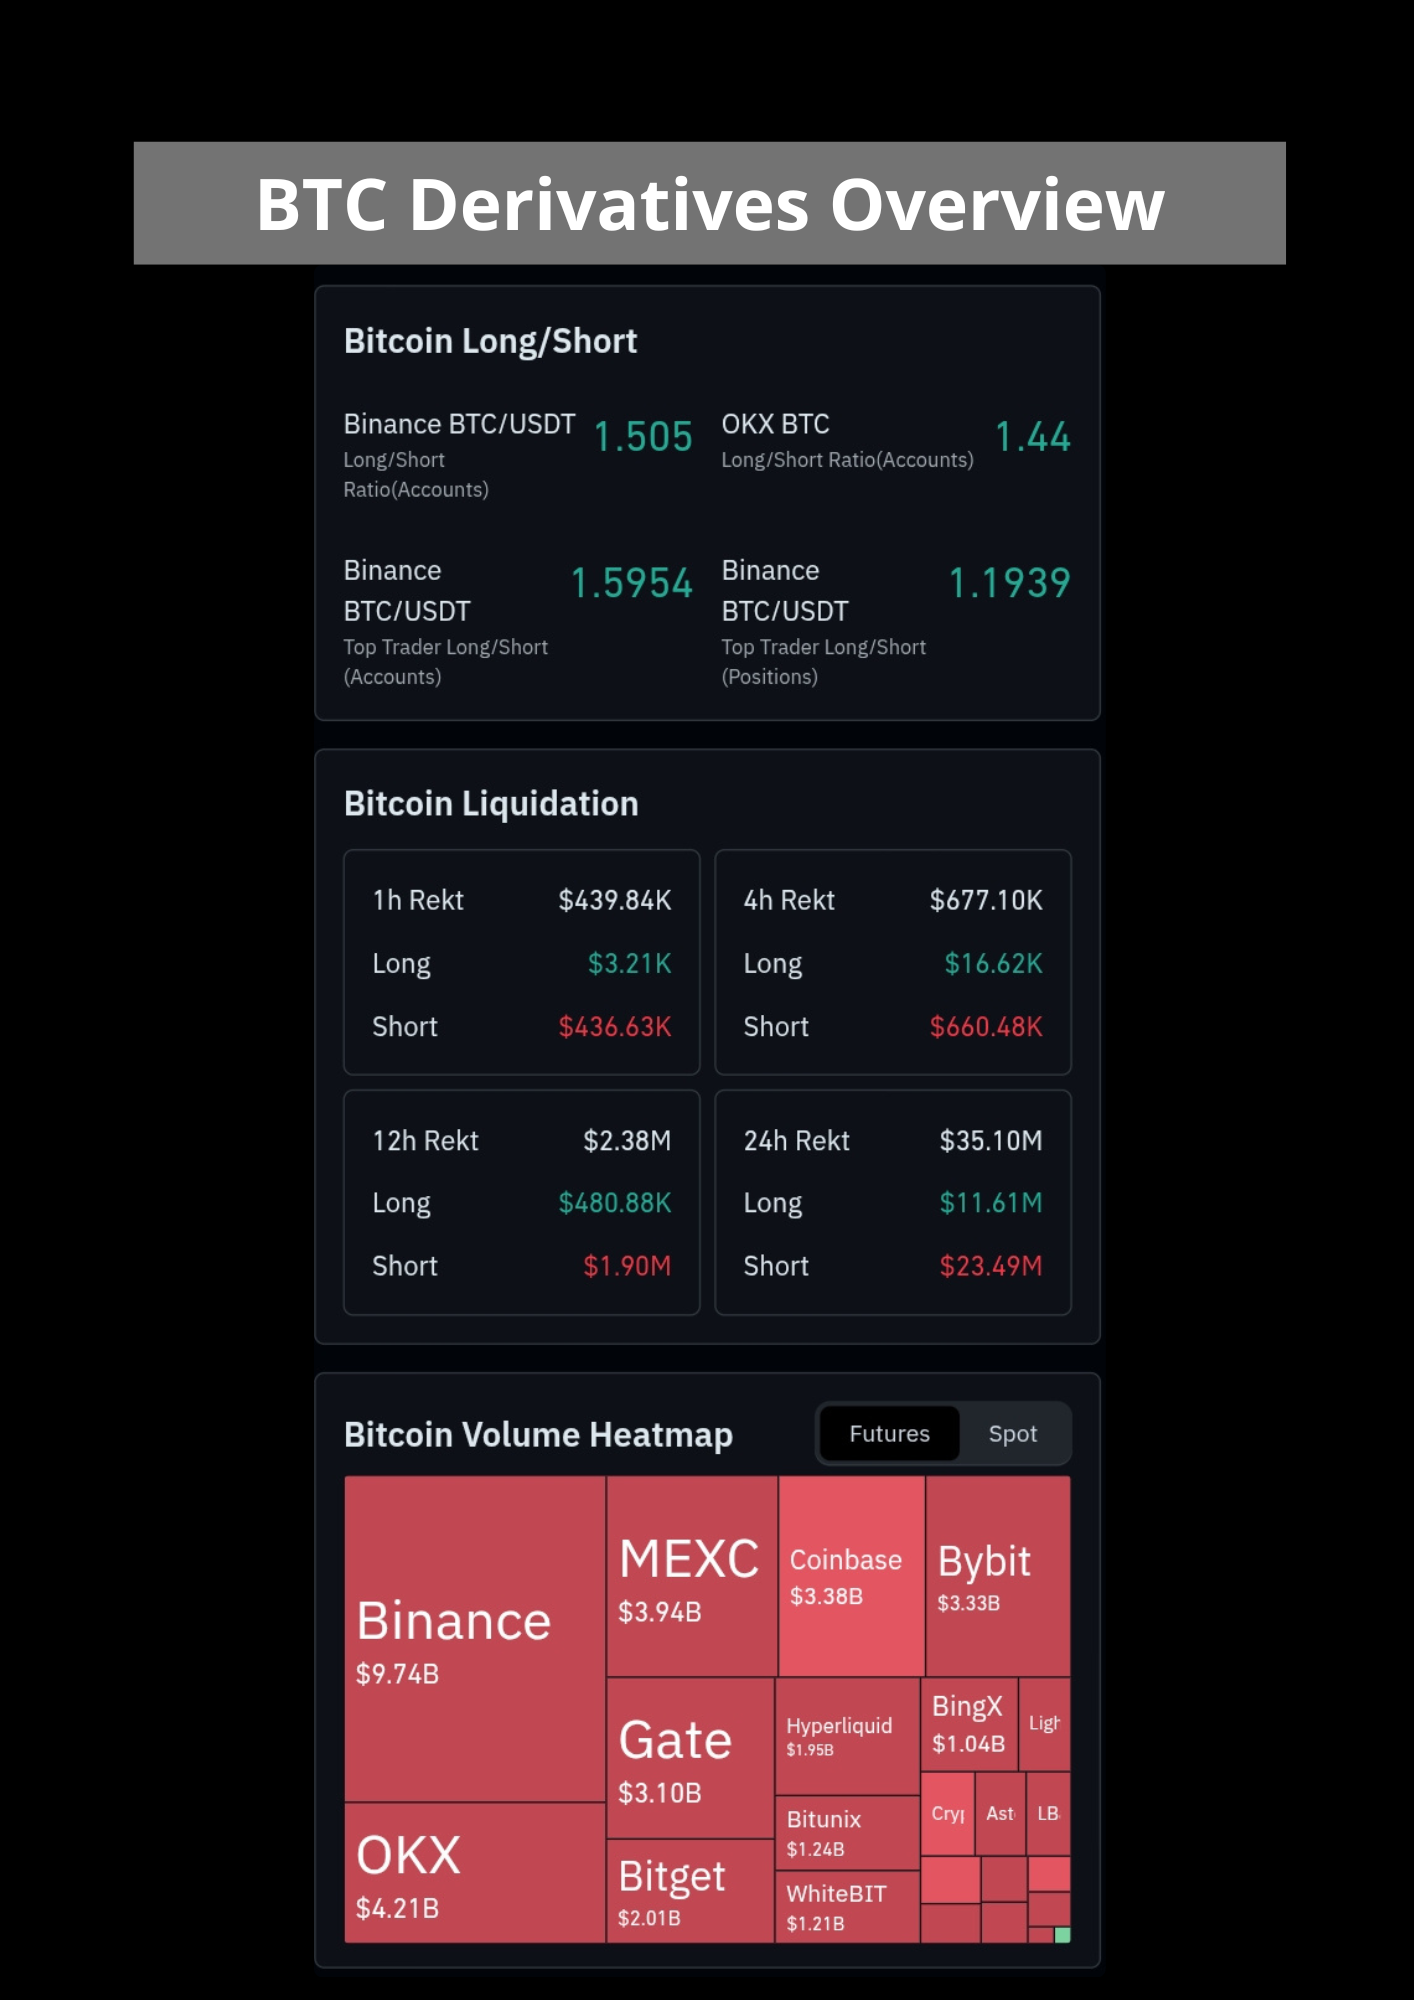
A deeper dive into the contract data shows that the long to short accounts ratio on exchanges like Binance and OKX is actually sitting firmly above 1. This confirms that while the general bias of regular accounts remains net long, it is the rapid, forced liquidations of overleveraged shorts that are causing massive spikes in dollar value wipeouts. The derivatives heatmap highlights this fierce battleground, showing explosive fee generations across major names like Binance, OKX, and MEXC.
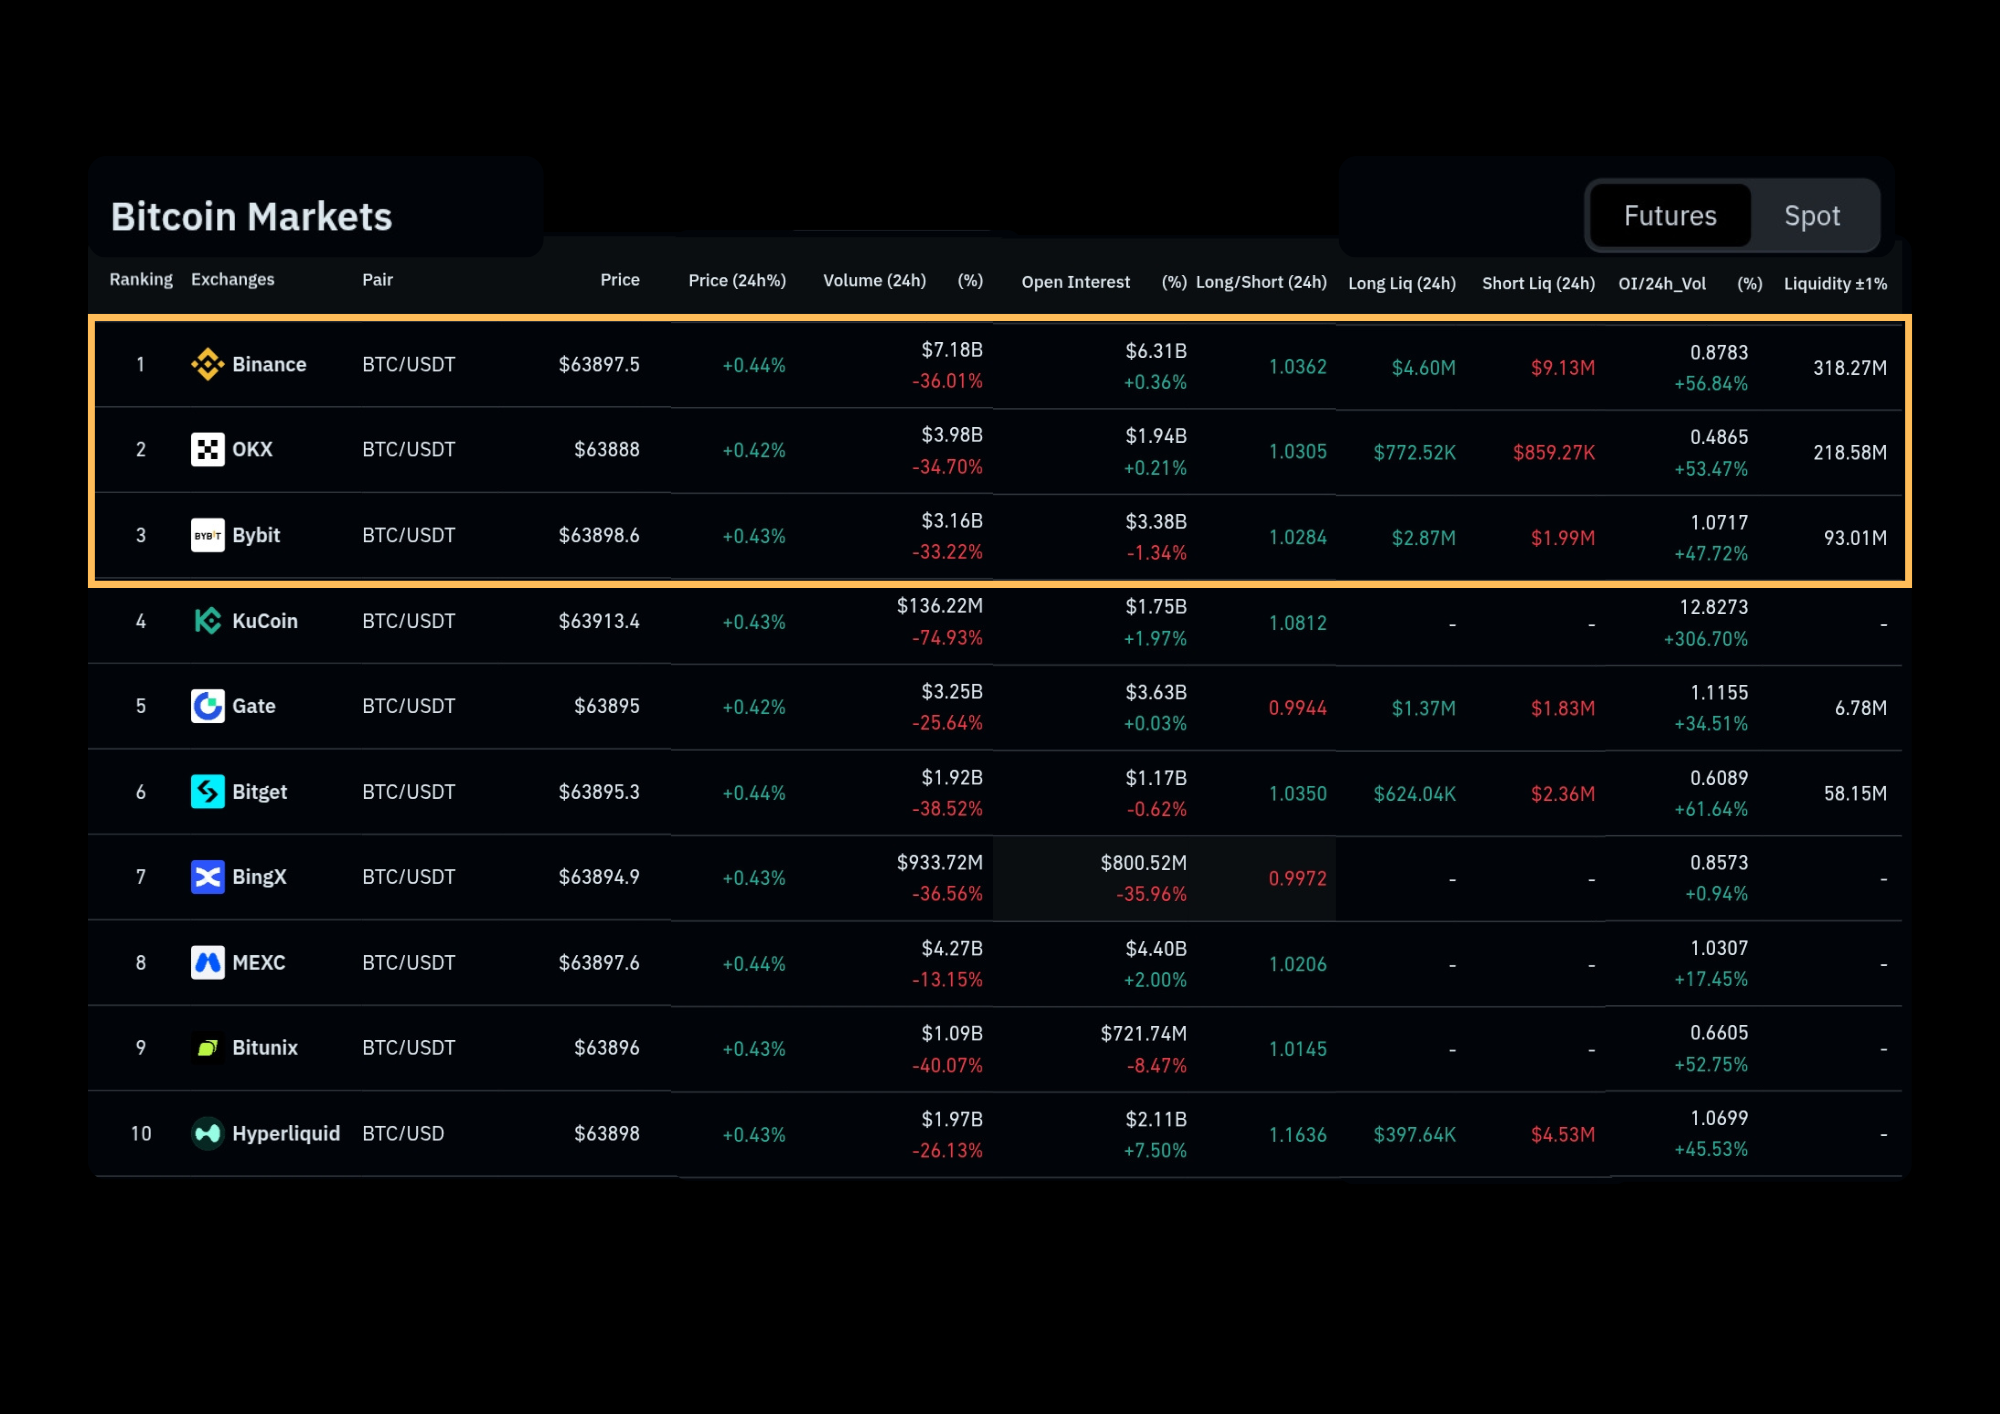
If you check out the highlighted yellow section within the spot exchange overview, the structural dominance of the top three tier one exchanges becomes incredibly obvious. Despite the current spot price fluctuating tightly between the $63,800 and $63,890 zone, the 1% order book depth is heavily stacked with hundreds of millions of dollars. Binance maintains the deepest liquidity book at $318.27 million, with OKX holding $218.58 million and Bybit securing $93.01 million.
However, the most revealing metric inside that yellow box is the negative 24 hour spot volume change. Trading interest has dried up by over 30% across the board, with Binance slipping 36.01% down to $7.18 billion, OKX dropping 34.70% to $3.98 billion, and Bybit decreasing 33.22% to $3.16 billion. This structural drop confirms that spot traders are explicitly choosing to step away from active order matching during this period of high uncertainty.
Price Action Chart and Bitcoin Support Resistance Map
The macro daily chart shows that Bitcoin has just executed a decisive bearish breakdown, slipping below the borders of the multi month symmetrical triangle that has dictated price action since the start of the year. This structural breakdown is occurring on declining historical spot volume, which emphasizes that the ongoing slide is driven more by a lack of strong buyers rather than an overwhelming surge of distribution.
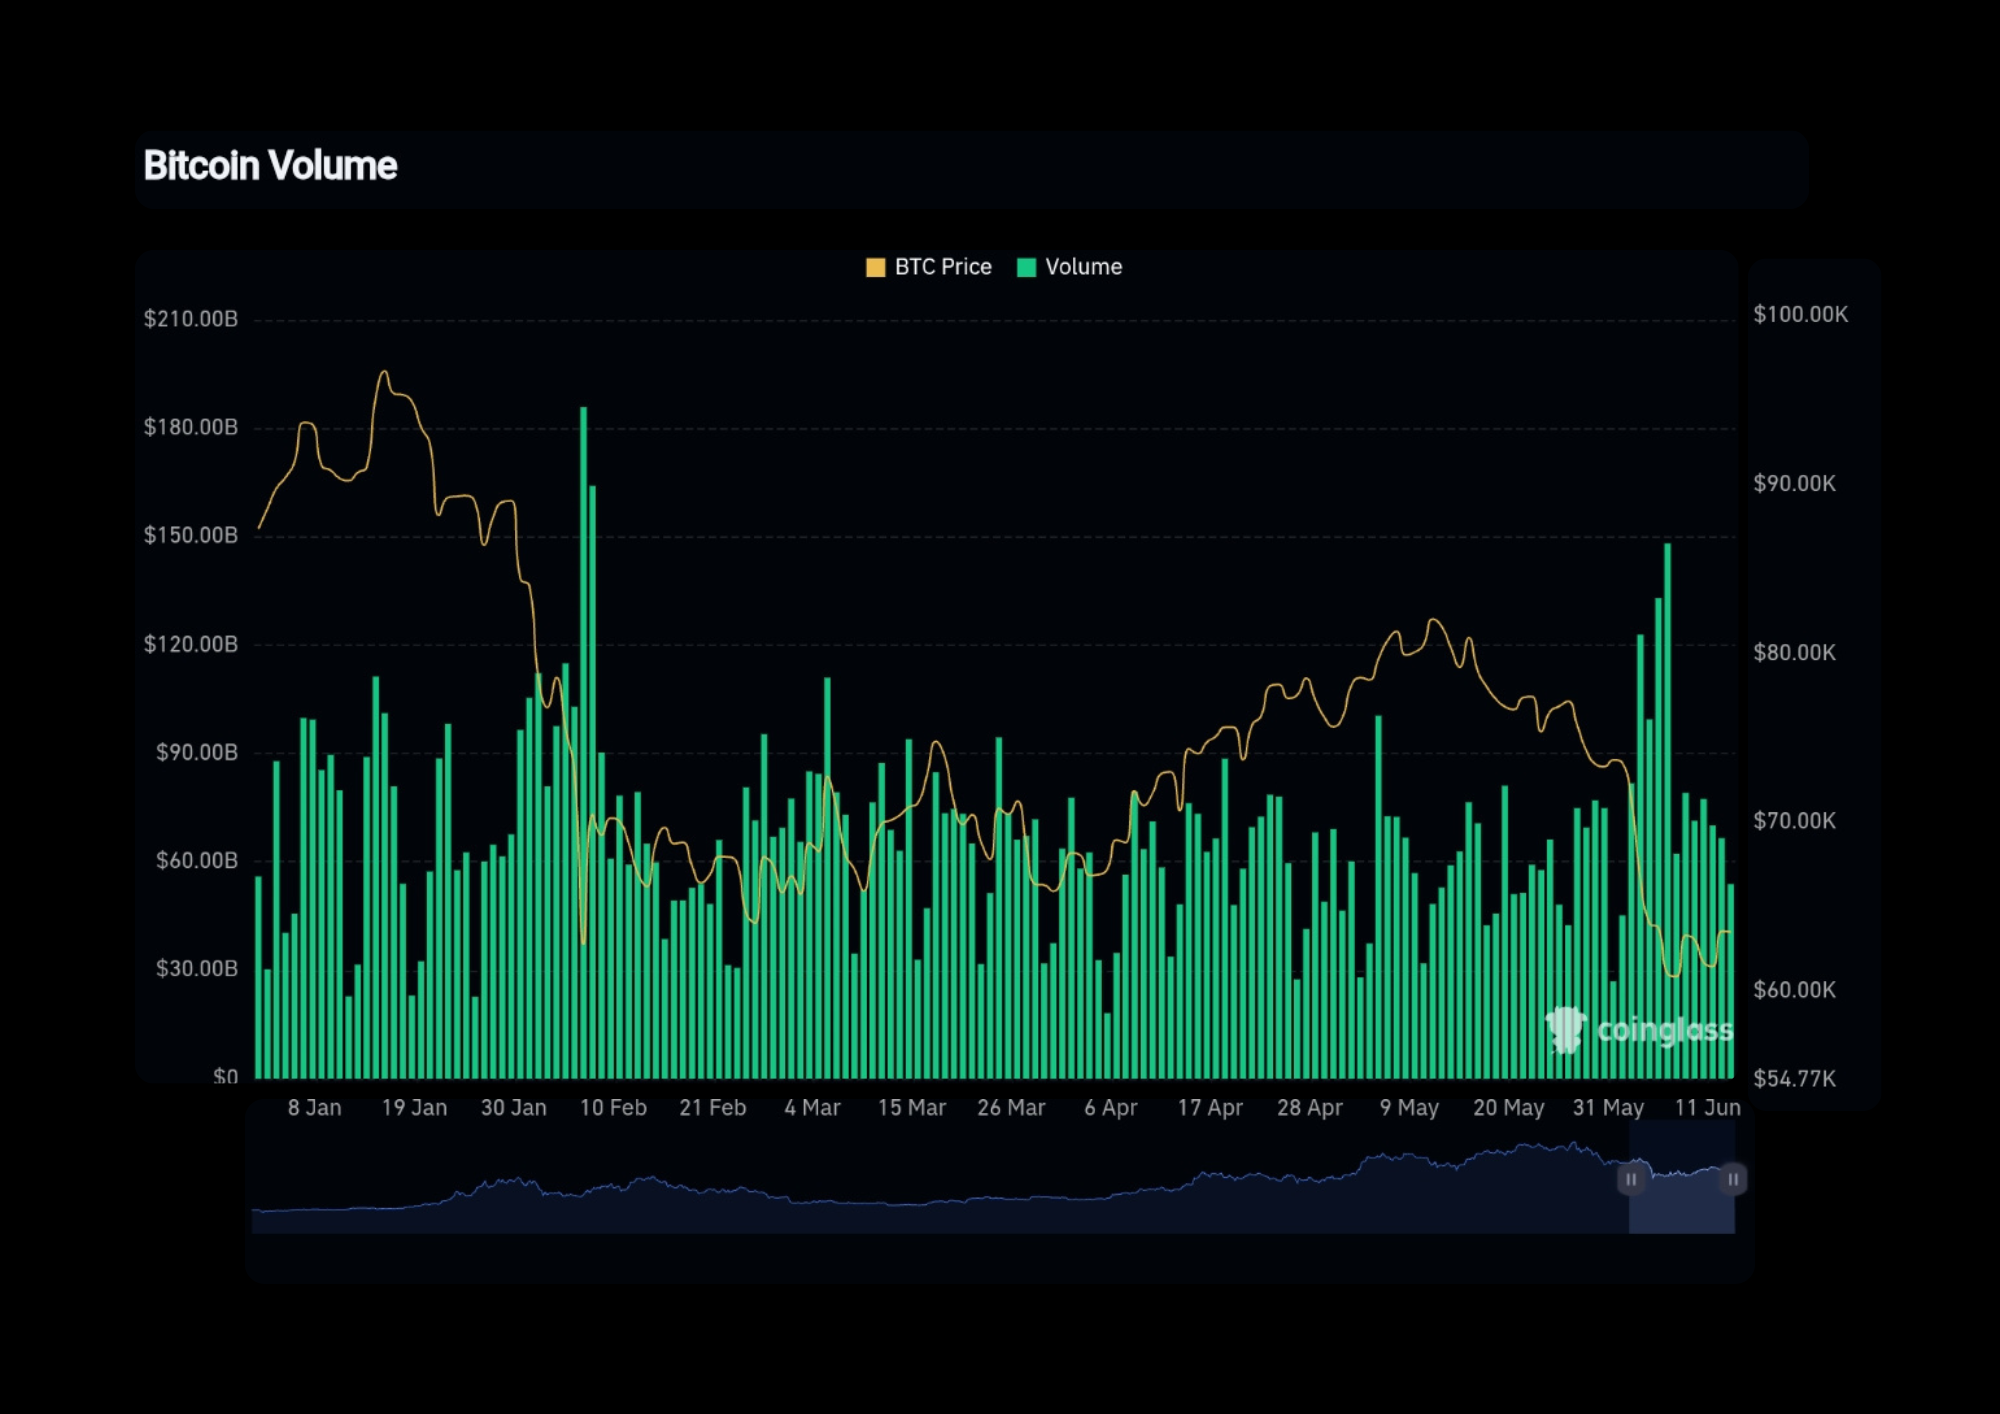
The shrinking volume oscillator on the daily chart perfectly mirrors the slow spot activity we just analyzed across the top order books, showing a clear depletion of immediate bull pressure.
For anyone looking to navigate these choppy waters, keeping a close eye on the updated support and resistance coordinates is going to be absolutely vital for proper risk management.
- Top Resistance Zone ($90.280 - $88.400) This stands as the absolute ceiling for the mid term market trend, lined up perfectly with a massive daily Fair Value Gap (FVG). As long as the price action remains trapped below this overhead imbalance, attempting to chase macro target extensions is highly risky.
- Second Resistance Zone ($74.265 - $73.060) This coordinate represents the previous baseline support of the triangle pattern which has now flipped into a key supply zone, further strengthened by a fresh daily bearish FVG.
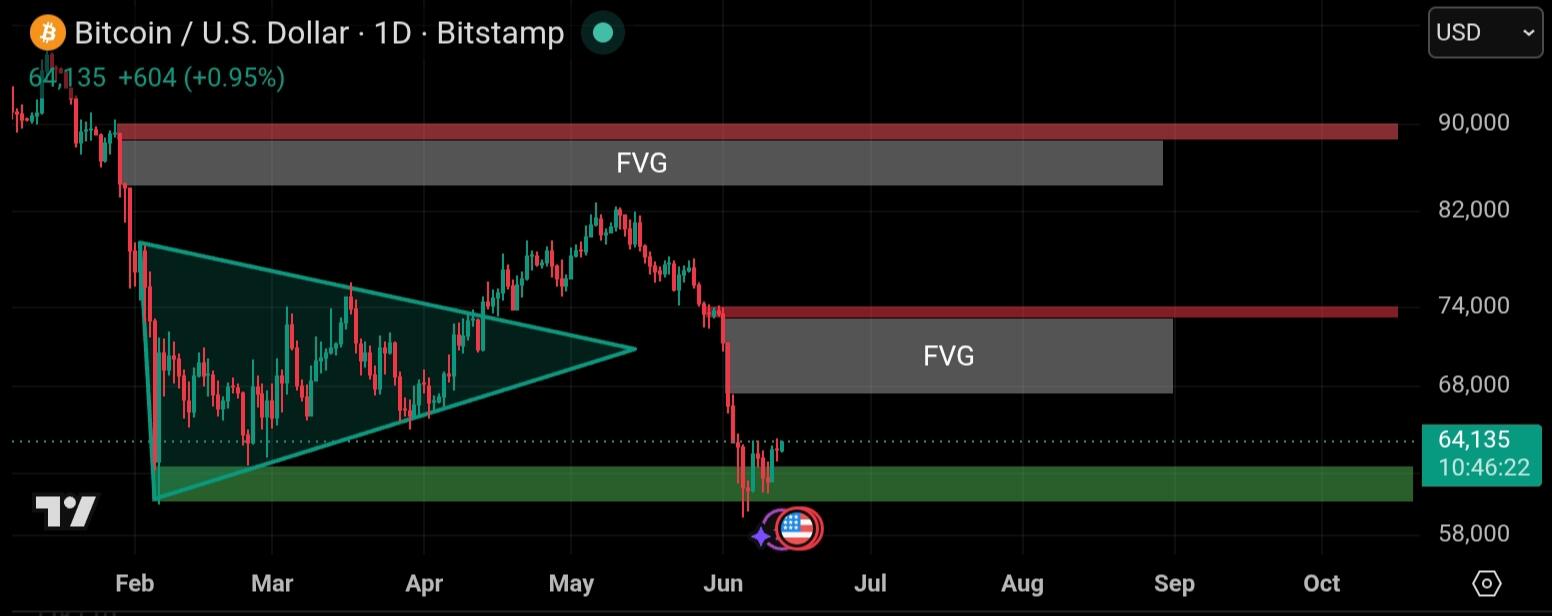
From a technical perspective, the daily candle closing outside of that triangle geometry means the price has slipped straight into the immediate green demand zone below.
This leaves us with the million dollar question, will the green support box at $62.560 - $60.000 successfully hold the line? Historically, this specific zone has served as a highly reactive demand floor that absorption algorithms use to accumulate spot coins. Given that the retail panic metrics are heavily overstretched to the downside, the odds of seeing an initial technical bounce right here remain relatively decent.
However, if the broader spot market fails to step up and this green box ends up giving way, the macro chart points to a secondary drop toward the deeper $52.290 - $50.520 territory. This lower cluster represents an essential historical swing low from the previous macro structure. Protecting this final line of defense is absolutely critical for the bulls if they want to prevent the structural higher time frame uptrend from flipping completely bearish.
Failing to sustain the current support would mean a deeper trip into that old accumulation base, making strict invalidation invalidation strategies a must for any active spot positions.
My Opinion
There is no sugarcoating the fact that watching support bands break down creates a tense atmosphere across the crypto community. Yet, if we strip away the short term negative noise, these extreme retail panic phases are precisely when the most lucrative market opportunities present themselves. Trying to catch knives with high leverage in a high liquidation environment is a fast track to getting wrecked, so a much wiser tactical play is focusing on on chain staking strategies. Transitioning into staking allows you to accumulate steady passive rewards while keeping your principal capital completely isolated from the daily futures chaos, letting you position your portfolio comfortably for the eventual market rebound.
Click here to read my authentic and original analysis
Source
⛔ Disclaimer: This article is strictly for informational and educational purposes only. It is not intended as financial advice, and I do not provide any trading signals. All investment decisions are your sole responsibility. Please ensure you conduct your own research (DYOR) before making any trades.