
How are traders feeling right now? Pretty happy, no doubt, since BTC has climbed back to $82k after the recent drop. Bitcoin is once again catching the attention of traders worldwide. The 50 day moving average is slowly closing in on the 200 day average, a formation known as the golden cross.
This moment comes after a long wait. Bitcoin has been sitting below this signal for almost 280 days, one of the longest stretches in its history.
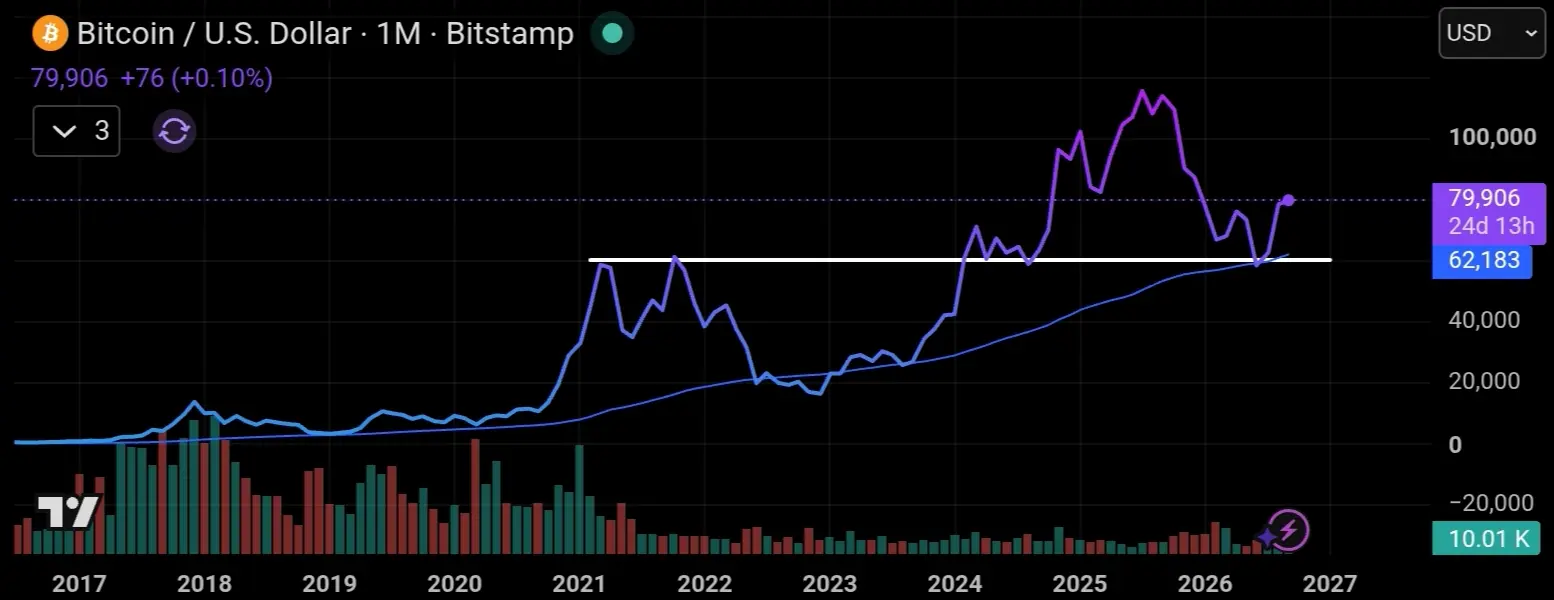
The track record of past golden crosses is pretty convincing. In September 2021 BTC rallied around 50%, October 2023 saw a 45% gain, and October 2024 shot up as much as 60%.
Also keep an eye on altcoins like SOL and DOGE. Usually, before Bitcoin reverses direction, these two altcoins tend to stall even while BTC is printing new highs.
That said, this signal is a lagging one. The golden cross only shows up after the actual price move has already played out, and it has even reversed within just a matter of weeks before, so extra caution is needed right now.
Looking at the 1 day chart, the 50 SMA and 200 SMA are starting to converge after a long downtrend. Many traders are already positioning early to catch this potential move.
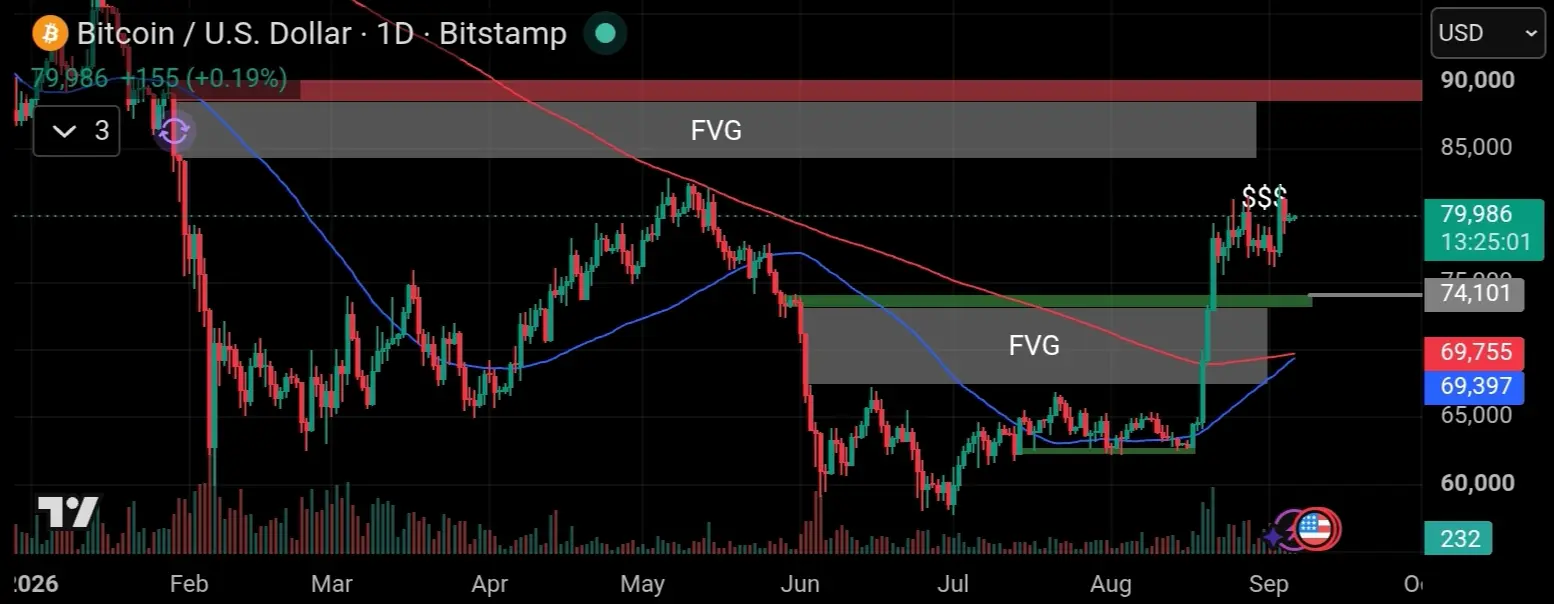
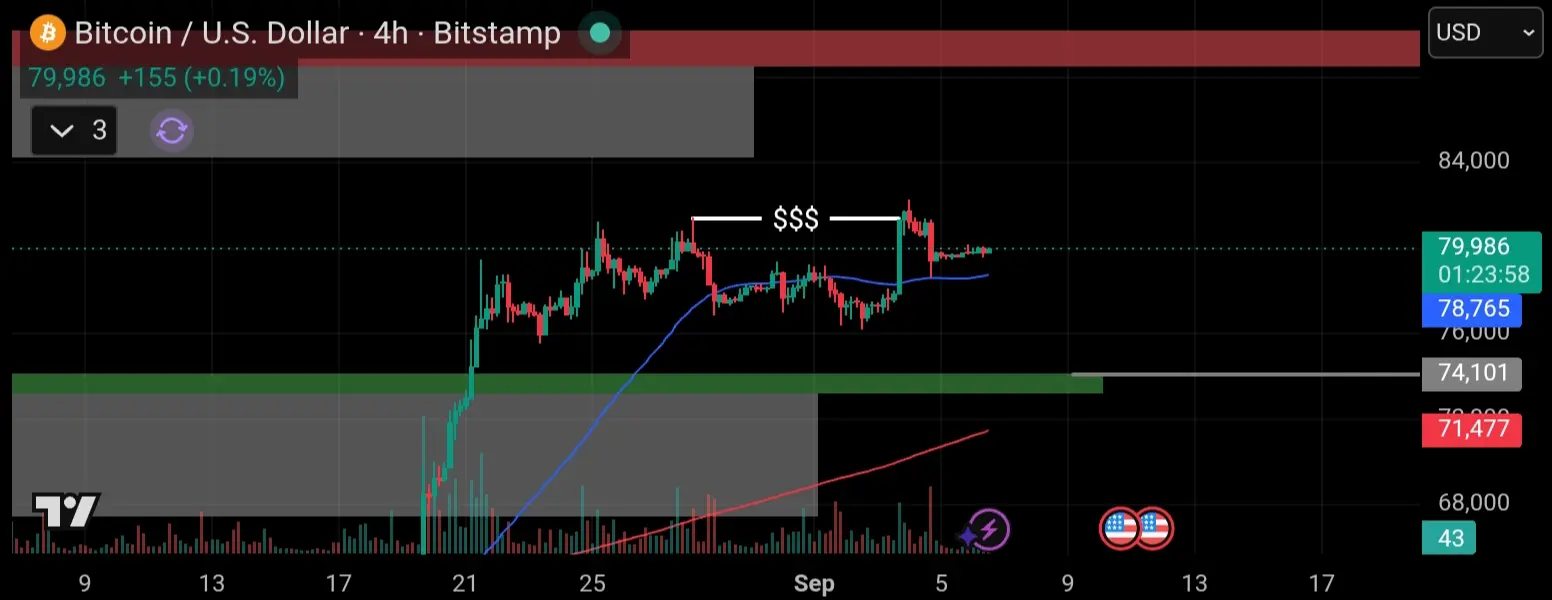
There's also an FVG sitting very close by in the $84,140 - $88,600 zone, which gives a strong signal that BTC could still push higher.
The golden cross remains a solid reference point for analysis, but it shouldn't be the only thing you rely on. Combining it with volume and support/resistance levels is still key before making any decisions. Nobody knows the real direction with 100% certainty. So make sure to manage your risk properly.
⛔Disclaimer - This analysis is for educational purposes and reflects personal opinion only, not financial advice. Always practice risk management and use stop losses (SL) according to your own risk tolerance.
Keep trading and stay profitable📊





