
Bitcoin (BTC) is currently facing a critical phase as buyers struggle to maintain higher ground. If you are tracking the market day to day, the main question is whether this correction will plunge deeper or find a solid floor to bounce back.
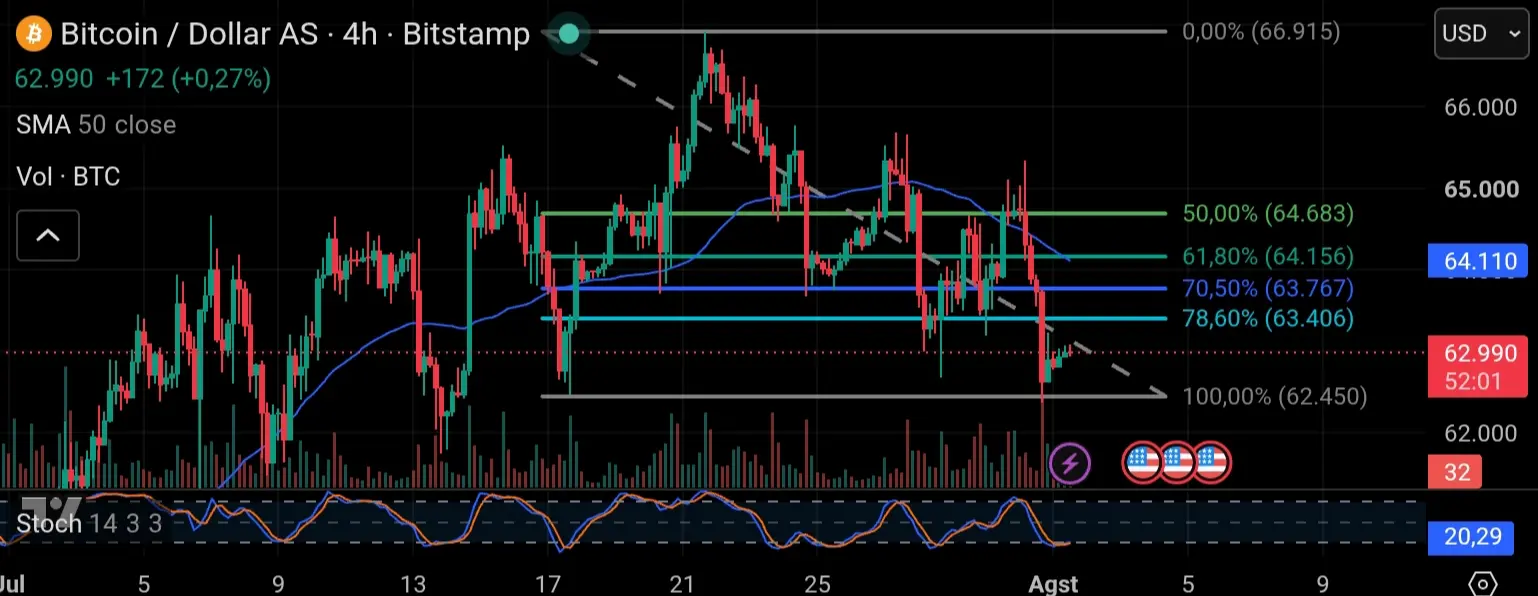
Let's inspect the current price action. On the 4 hour chart, bitcoin has pulled back from its recent swing high near $66,915 and is now consolidating close to a key support zone around $62,450, aligning directly with the 100% Fibonacci level.
Momentum is clearly shifting. The price has dropped below the 50 period simple moving average , signaling that buying pressure is losing its grip. Furthermore, the asset slipped under the 78.60% Fibonacci marker at $63,406. If the 4 hour candles manage a clean breakdown below the $62,450 support, a swift continuation toward the sub $62,000 territory becomes highly probable.
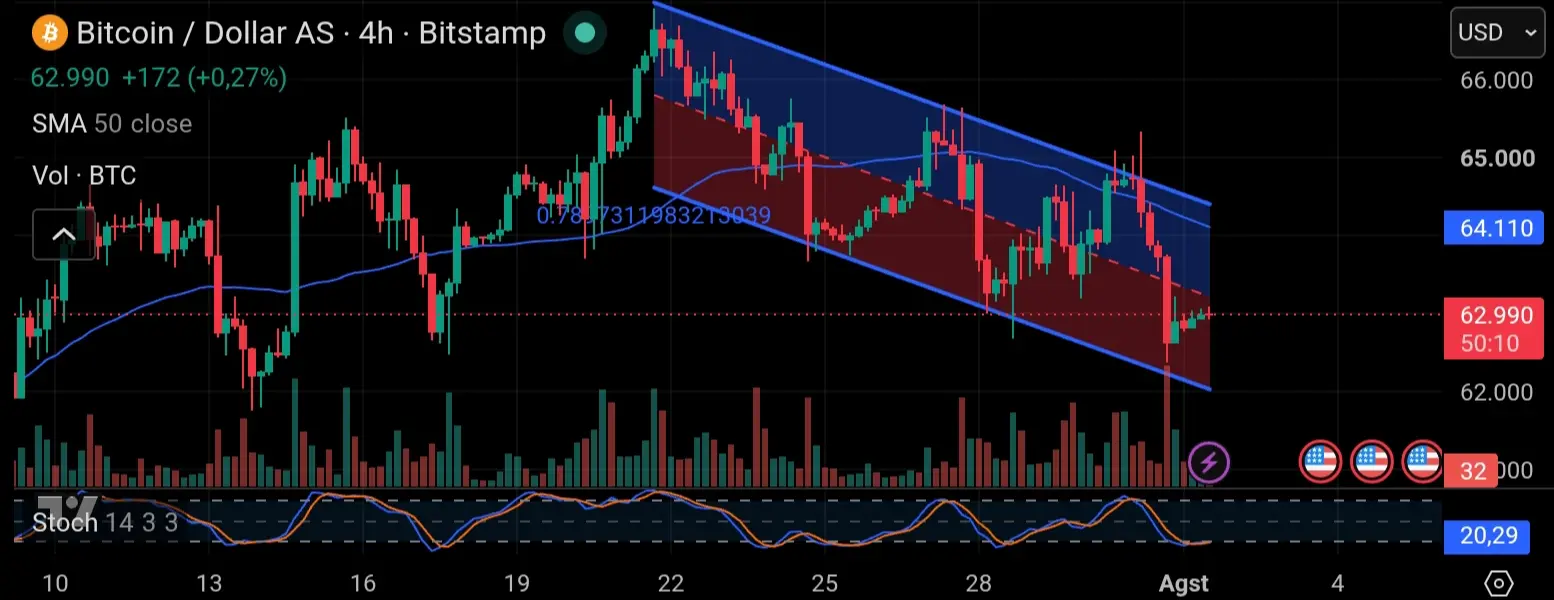
Zooming out into a broader perspective using a descending channel, BTC's structure consistently prints lower highs and lower lows. The latest rejection happened precisely when price tapped the upper boundary of this channel.
Additionally, a surge in selling volume right through the middle of the channel validates strong seller dominance. The stochastic indicator is also rolling over from the overbought territory and pointing downward, confirming that the bearish momentum remains active.
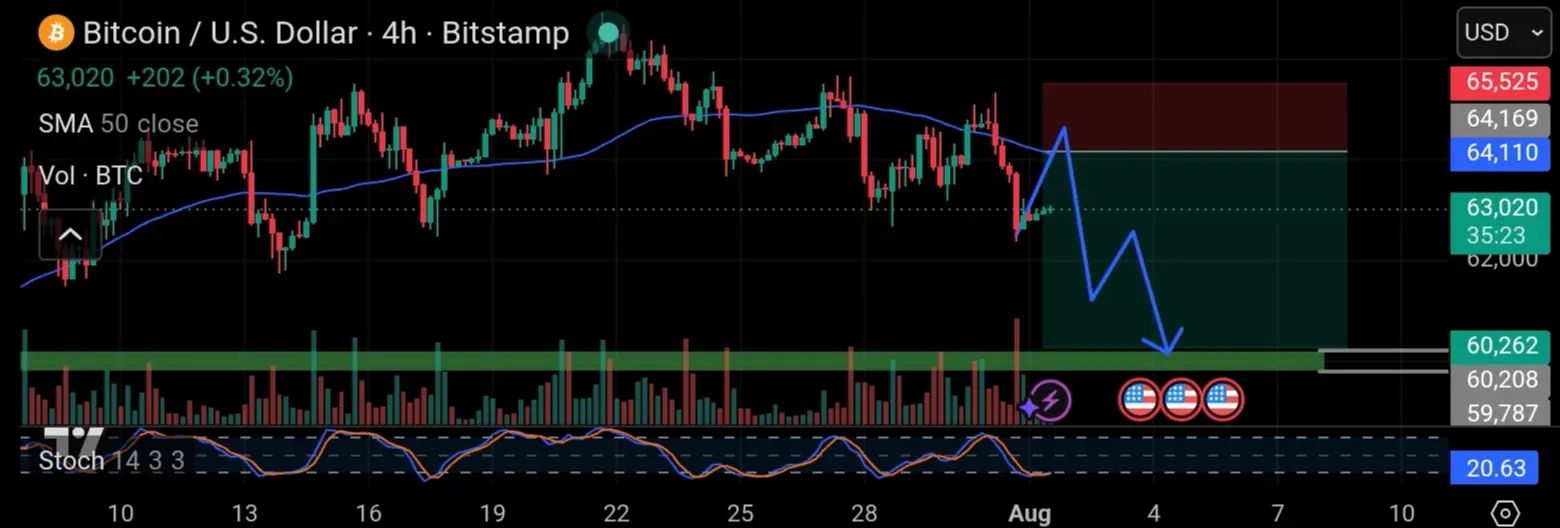
Given this technical setup, there is a clean short position opportunity equipped with a structured risk management plan for traders to evaluate.
The suggested entry for a short position sits around $64,110. To protect against sudden fakeouts, a stop loss can be placed near $65,525, exposing you to roughly 2.11% risk (1,356 points). Meanwhile, the take profit target is mapped out at $60,208, offering a potential reward of about 6.08% (3,907 points). This yields an attractive risk to reward ratio of 2.88.
To wrap things up, keep in mind that this entire technical analysis and short setup are derived strictly from pure price action and chart indicators visible right now. This breakdown does not factor in external macro or microeconomic catalysts that can shift market direction instantly. Should major news or statements from the Fed hit the wire later and alter market momentum, this technical outlook could easily adapt or invalidate. My objective here is purely to map out what the current chart structure dictates so traders can approach the market with clear, objective risk parameters.
Click here to read my authentic and original analysis
⛔Disclaimer - This analysis is for educational purposes and reflects personal opinion only, not financial advice. Always practice risk management and use stop losses (SL) according to your own risk tolerance.
Keep trading and stay profitable📊💪





