
The cryptocurrency market is facing a highly critical turning point as the United States Senate accelerates its efforts to pass a brand new regulatory framework. For global traders, this development is a massive deal because the legislative timeline is incredibly tight. With the US Congress scheduled for a recess in august and the Midterm Elections looming on november 3rd, bipartisan negotiators are working under intense pressure to iron out a final deal before the major july 4th deadline, which is just 9 days away.
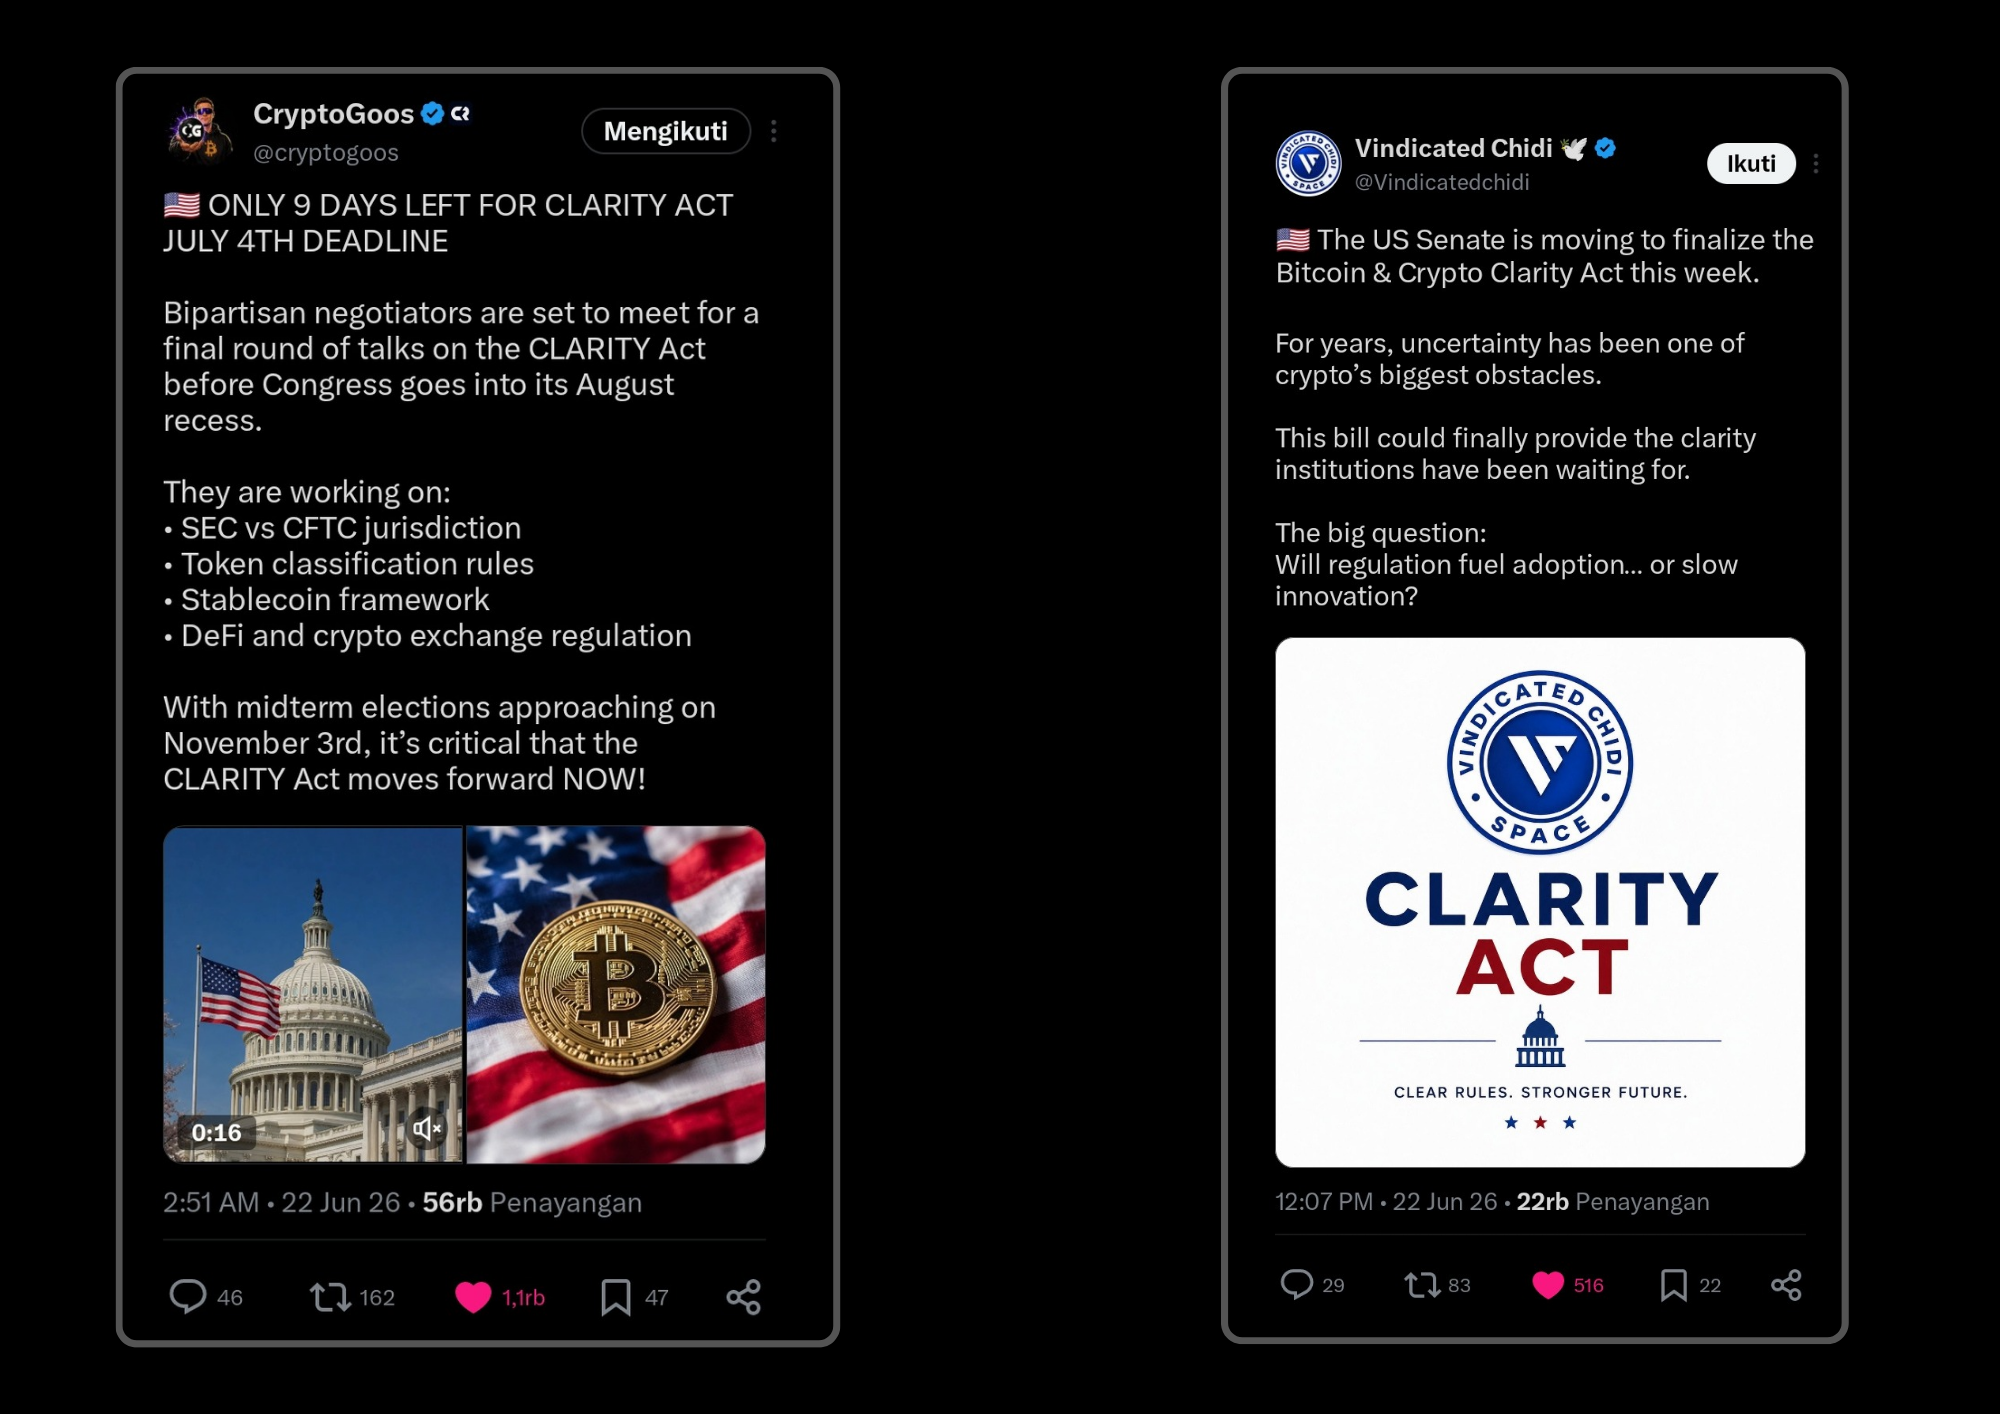
At its core, this upcoming bill aims to solve a long standing headache establishing a clear line of authority between the SEC and the CFTC. Furthermore, it addresses crucial areas such as official token classifications, stablecoin operational rules, and stricter guidelines for decentralized finance (DeFi) platforms and centralized exchanges. While institutional players have been waiting years for this type of legal certainty, the trading community remains divided on a primary concern will this sweeping regulation act as a catalyst for mainstream adoption, or will it stifle technical innovation?
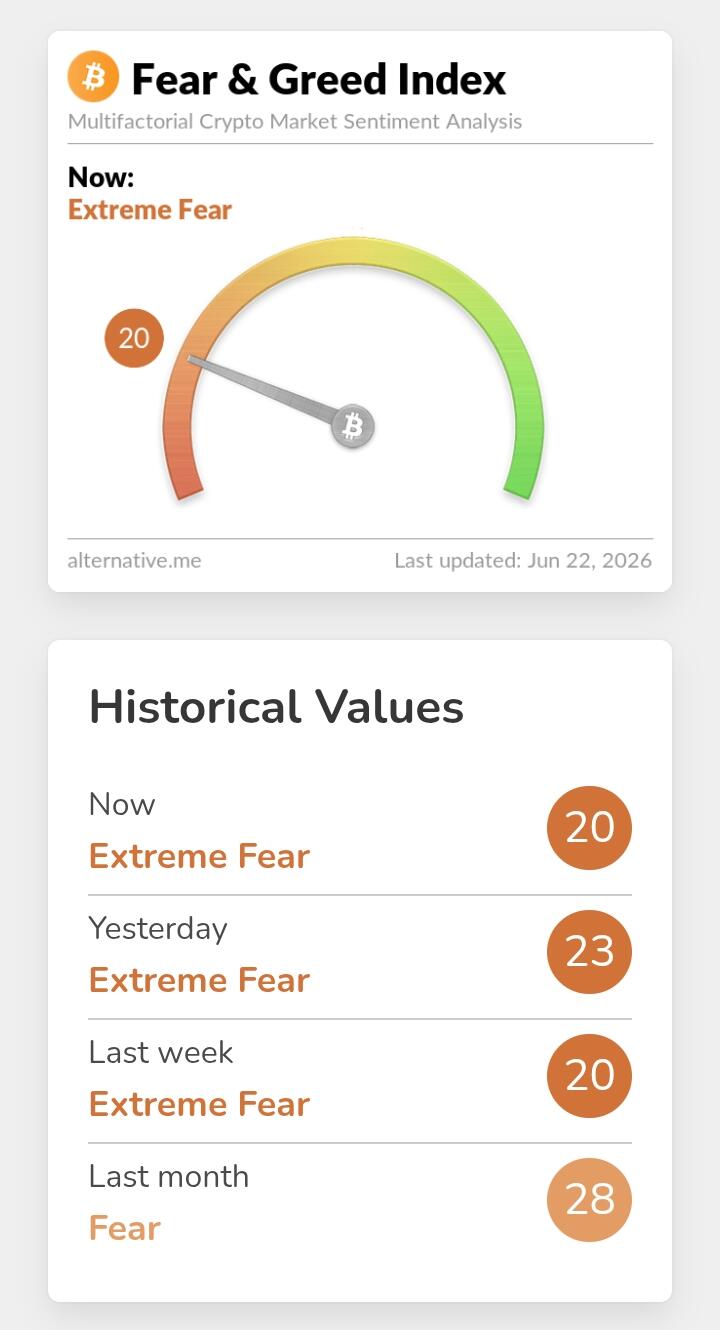
This high stakes political drama and the resulting regulatory fog have taken a clear toll on overall market psychology. The crypto fear and greed sentiment index currently flashes a warning sign, plunging deep into the extreme fear zone. A closer look at the historical timeline shows a persistent downward trend in market confidence.
- Current Status (Now): The index stands at 20, marking a state of Extreme Fear.
- Previous Day (Yesterday): It sat at 23, firmly inside the Extreme Fear bracket.
- One Week Ago (Last week): It was completely flat, holding steady at 20.
- One Month Ago (Last month): The mood was slightly healthier at 28, categorized under standard Fear.
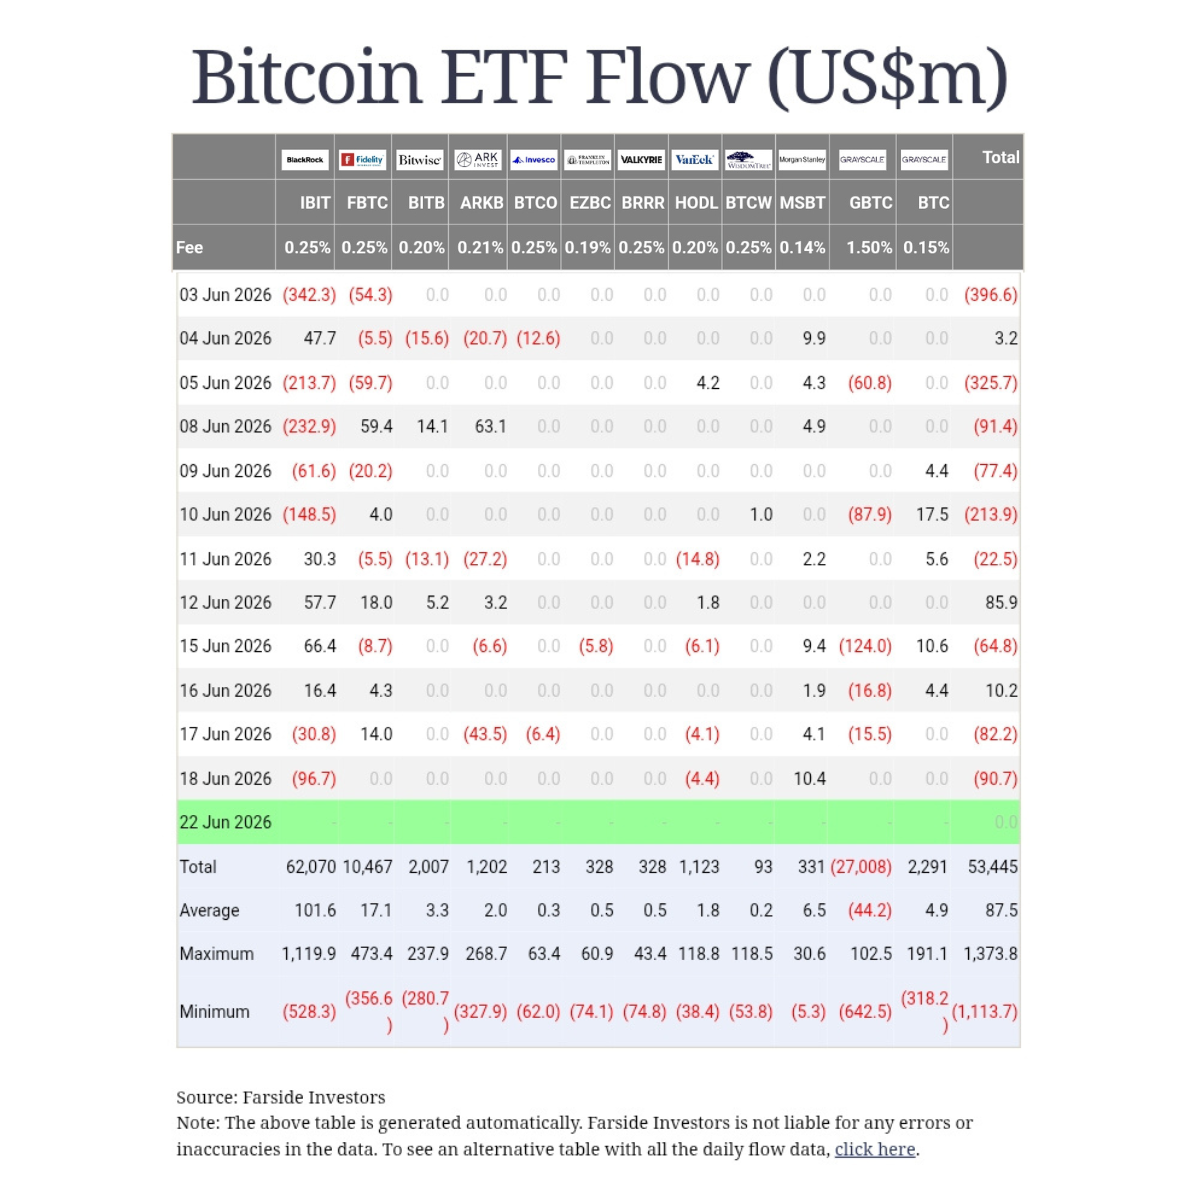
This negative sentiment isn't just psychological it is heavily reflected in institutional capital movements. Looking closely at the bitcoin Spot ETF tracker, major funds have been consistently withdrawing substantial amounts of capital (net outflows) throughout june 2026. This aggressive institutional sell off is highly visible on these specific dates.
- June 3, 2026: A heavy net capital drop of -$396.6M.
- June 5, 2026: Another major wave of selling resulting in -$325.7M.
- June 10, 2026: Outflows continuing at -$213.9M.
Prominent investment vehicles, particularly BlackRock's IBIT and Fidelity's FBTC, continue to serve as the main barometers for these aggressive institutional shifts.
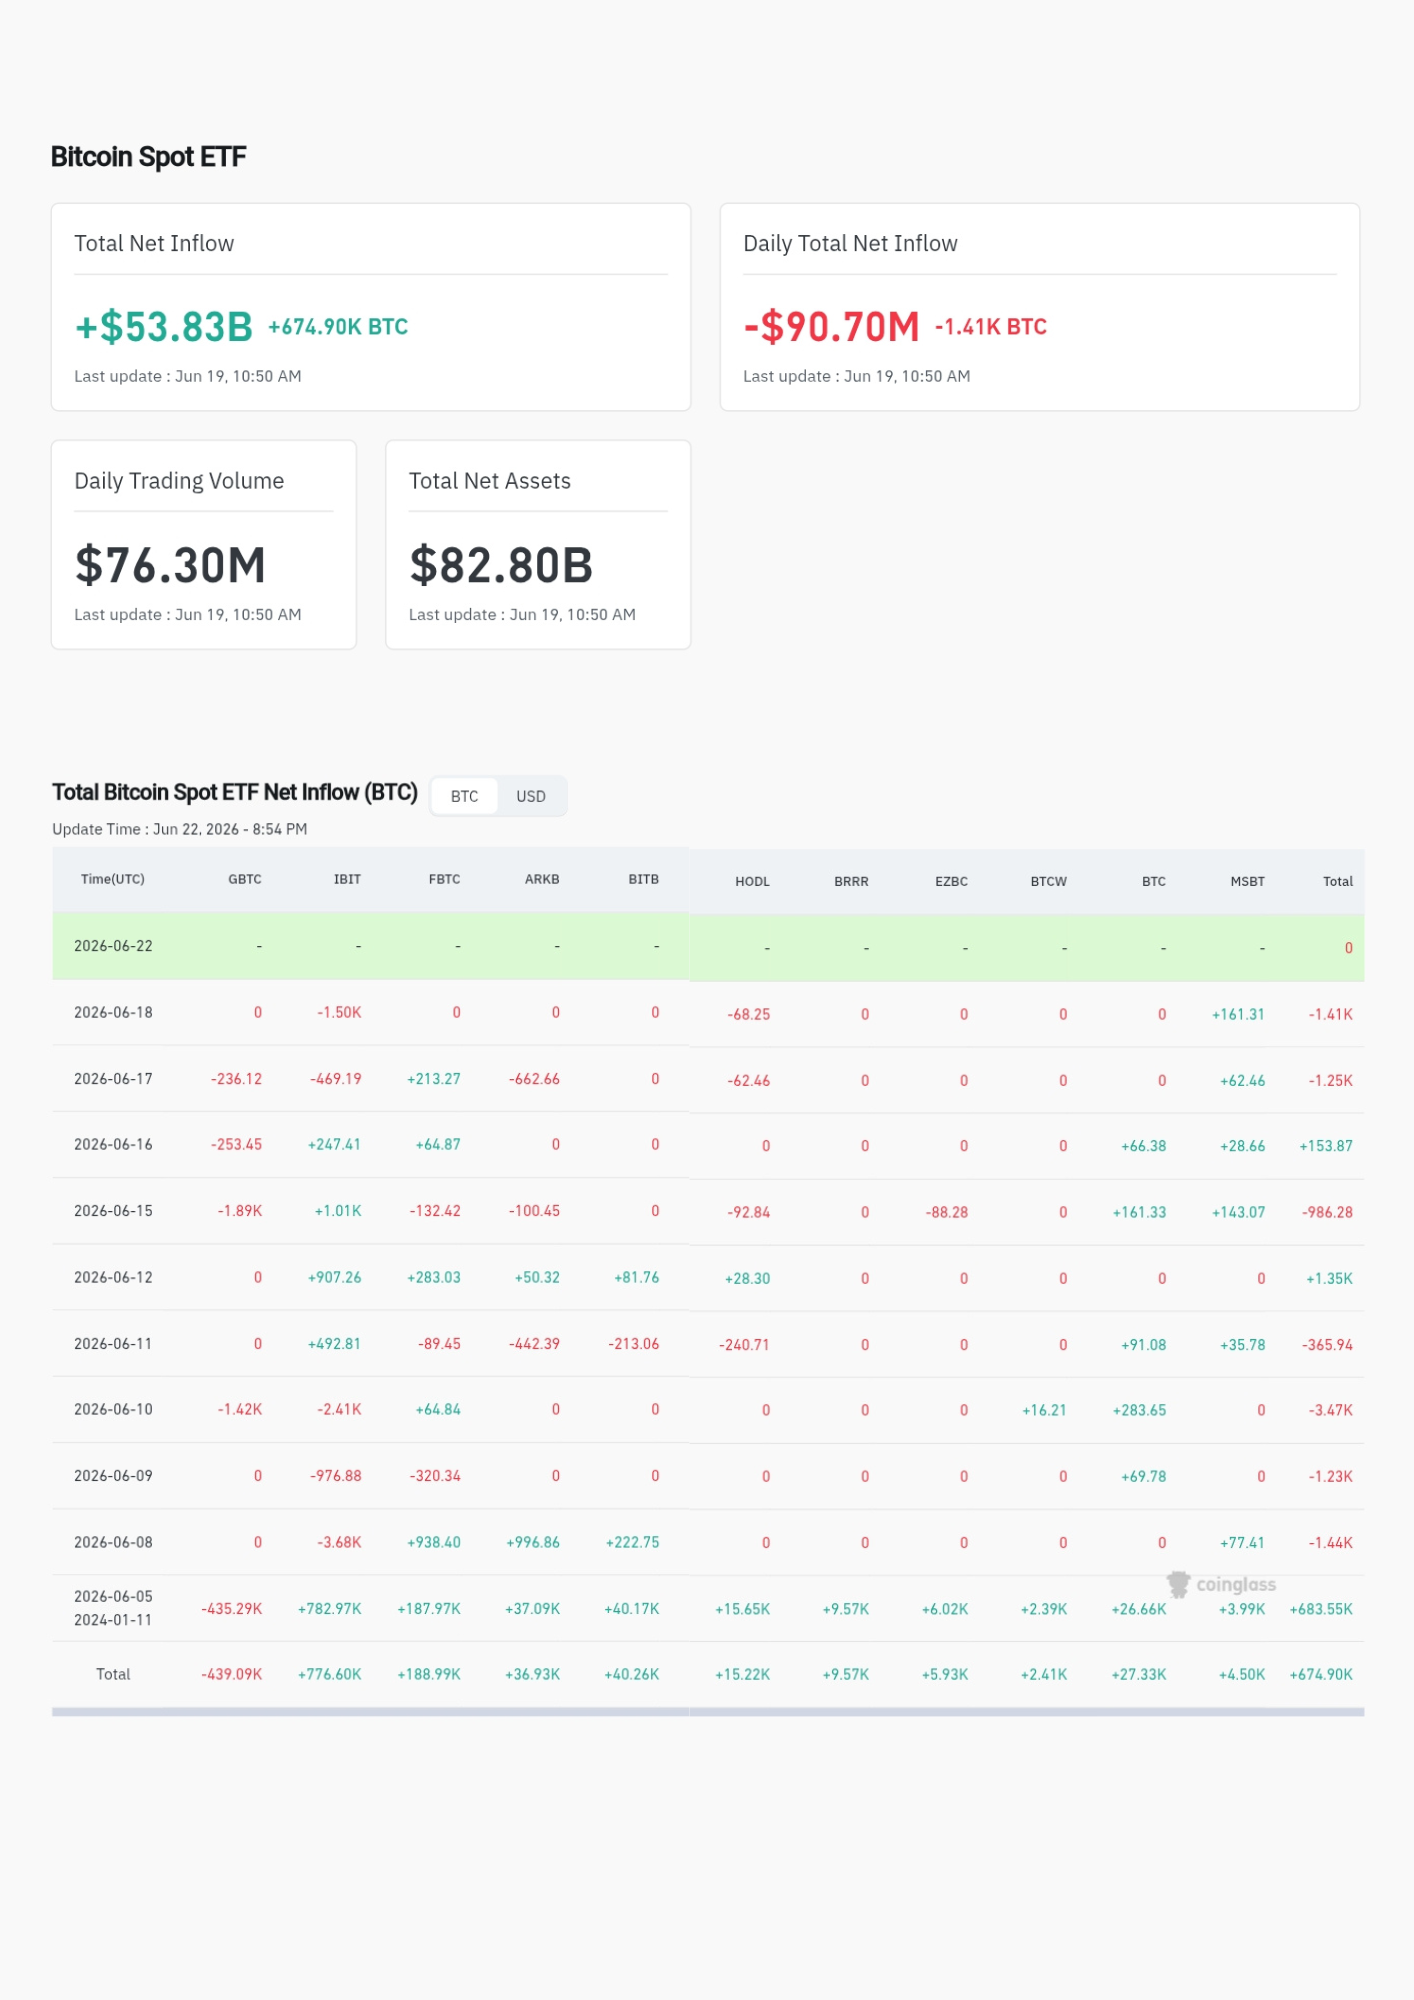
However, zooming out to the broader macro perspective reveals that the fundamental ecosystem for bitcoin spot ETFs remains remarkably resilient.
- Total Net Inflow: Cumulative net capital entering the market since launch sits at a comfortable surplus of $+53.83B, representing over $+674.90K BTC.
- Daily Total Net Inflow: On a short term basis, the daily inflow recently dipped by -$90.70M, which equates to a loss of roughly -1.41K BTC in a single trading session.
- Total Net Assets: The aggregate value of assets managed across these major funds is holding steady at $82.80B.
This data suggests that while short term capital is fleeing, large scale fund managers are simply playing defense and choosing a wait and see approach until Washington delivers a final verdict.
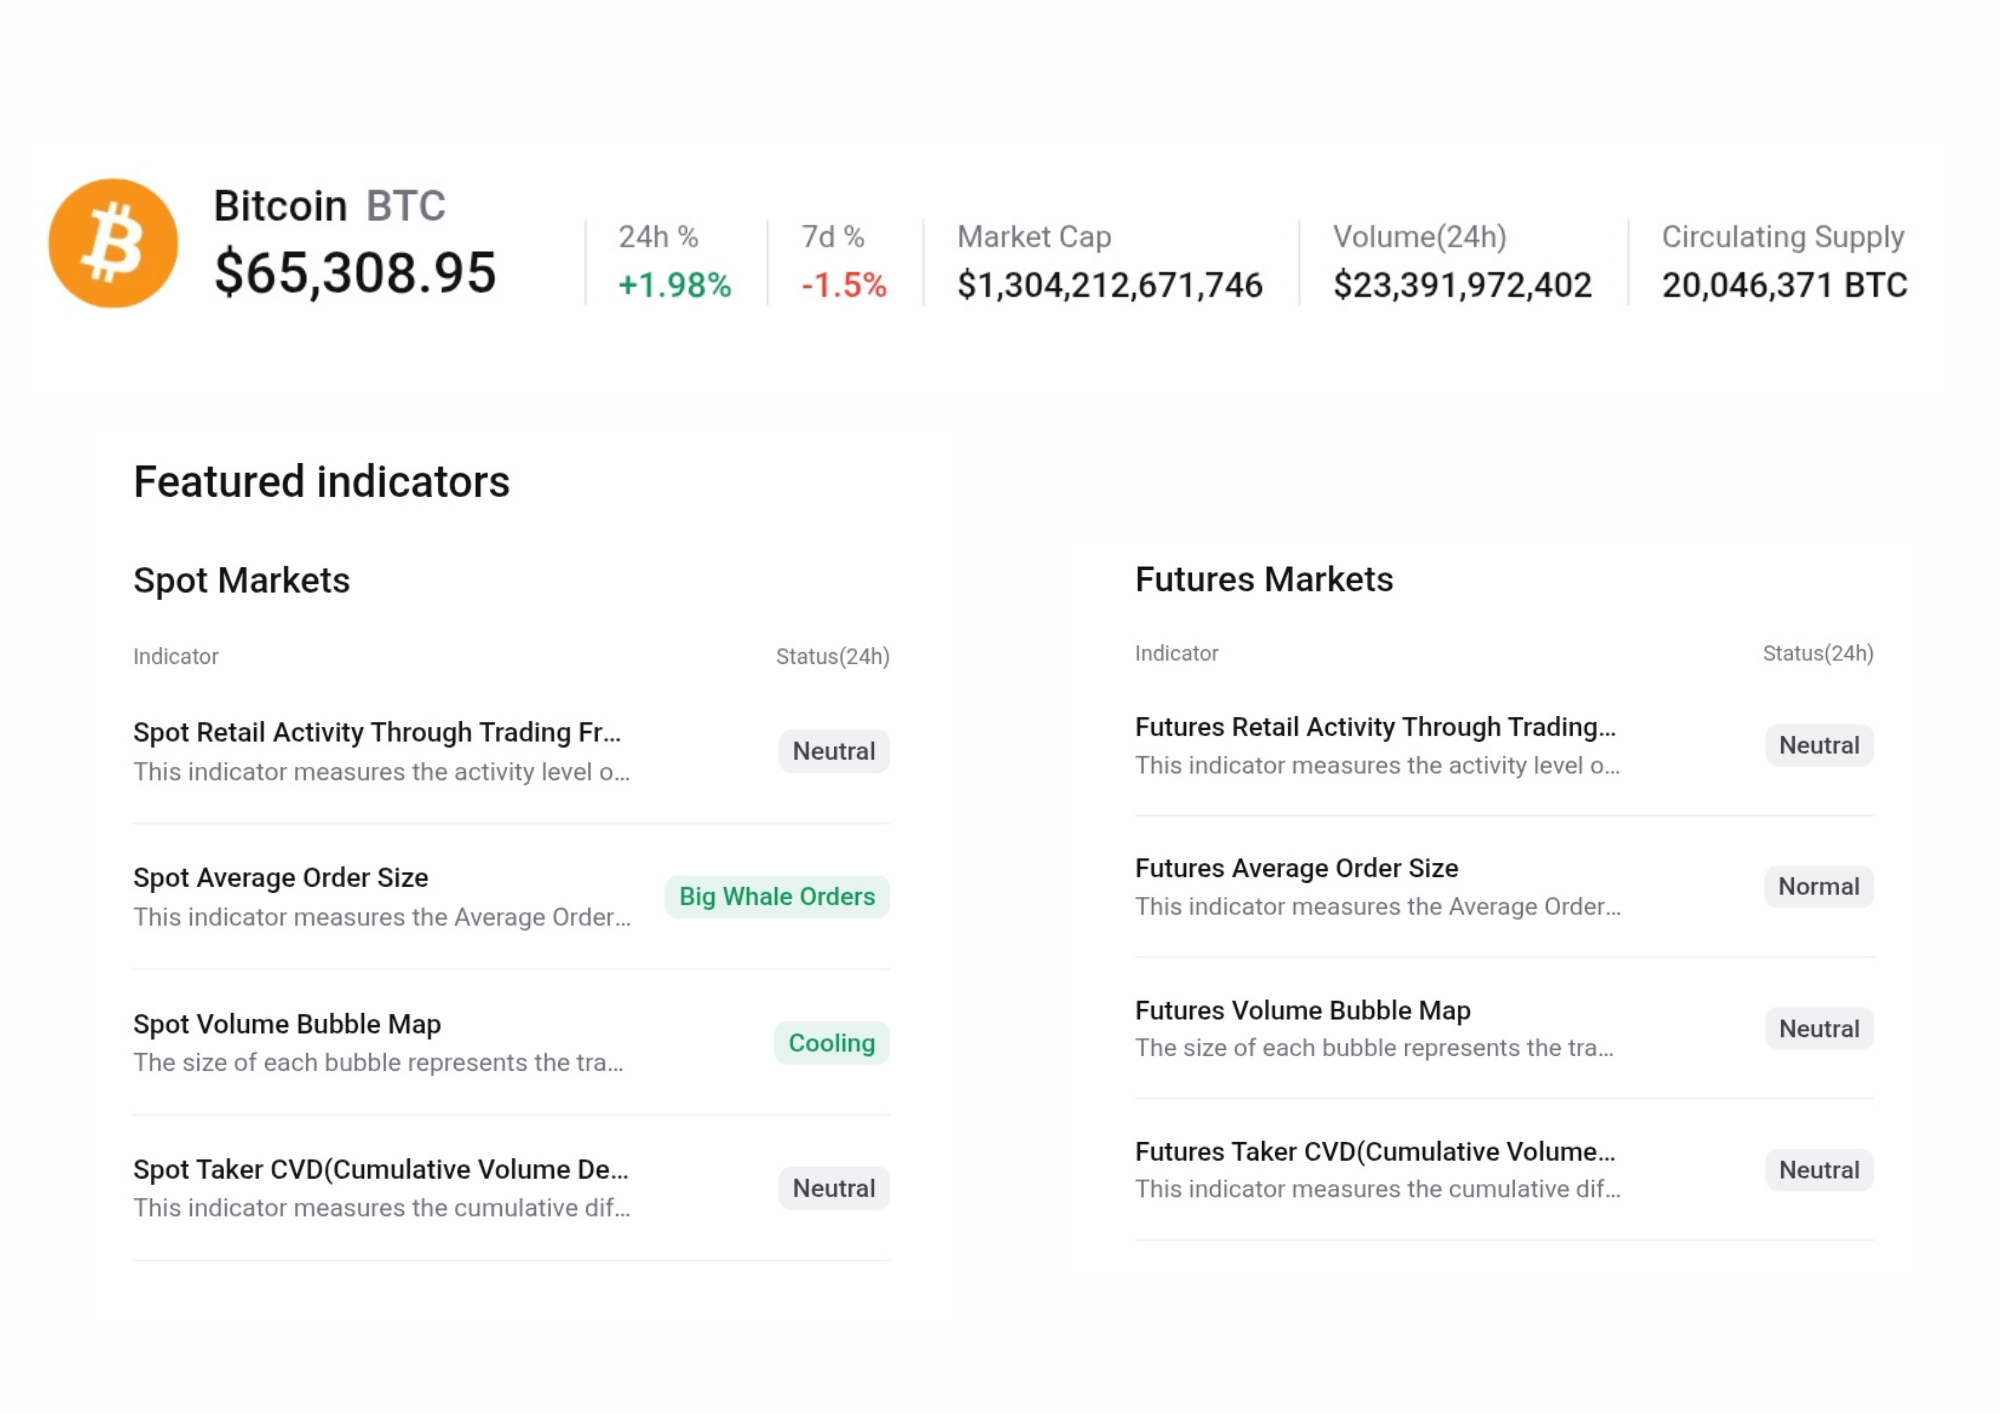
Shifting our focus to the spot market, bitcoin is currently trading sideways, consolidating tightly around the $65,308.95 mark. While it posted a modest 24 hour gain of +1.98%, its weekly performance remains in the red by about -1.5%. bitcoin’s overall market capitalization is holding at $1.30T, backed by a 24 hour trading volume of $23.39B.
For short term scalpers and swing traders, analyzing the underlying exchange indicators reveals several vital metrics.
- Spot Retail Activity: Participation from everyday retail accounts is completely Neutral.
- Spot Average Order Size: The order book is highly dominated by big Whale orders, indicating large players are actively positioning themselves.
- Spot Volume Bubble Map: The overall volume density is experiencing a notable Cooling phase.
- Futures Markets: Across the board, key derivatives indicators including retail engagement, order sizing, and cumulative volume delta (CVD) are reflecting a unified Neutral stance.
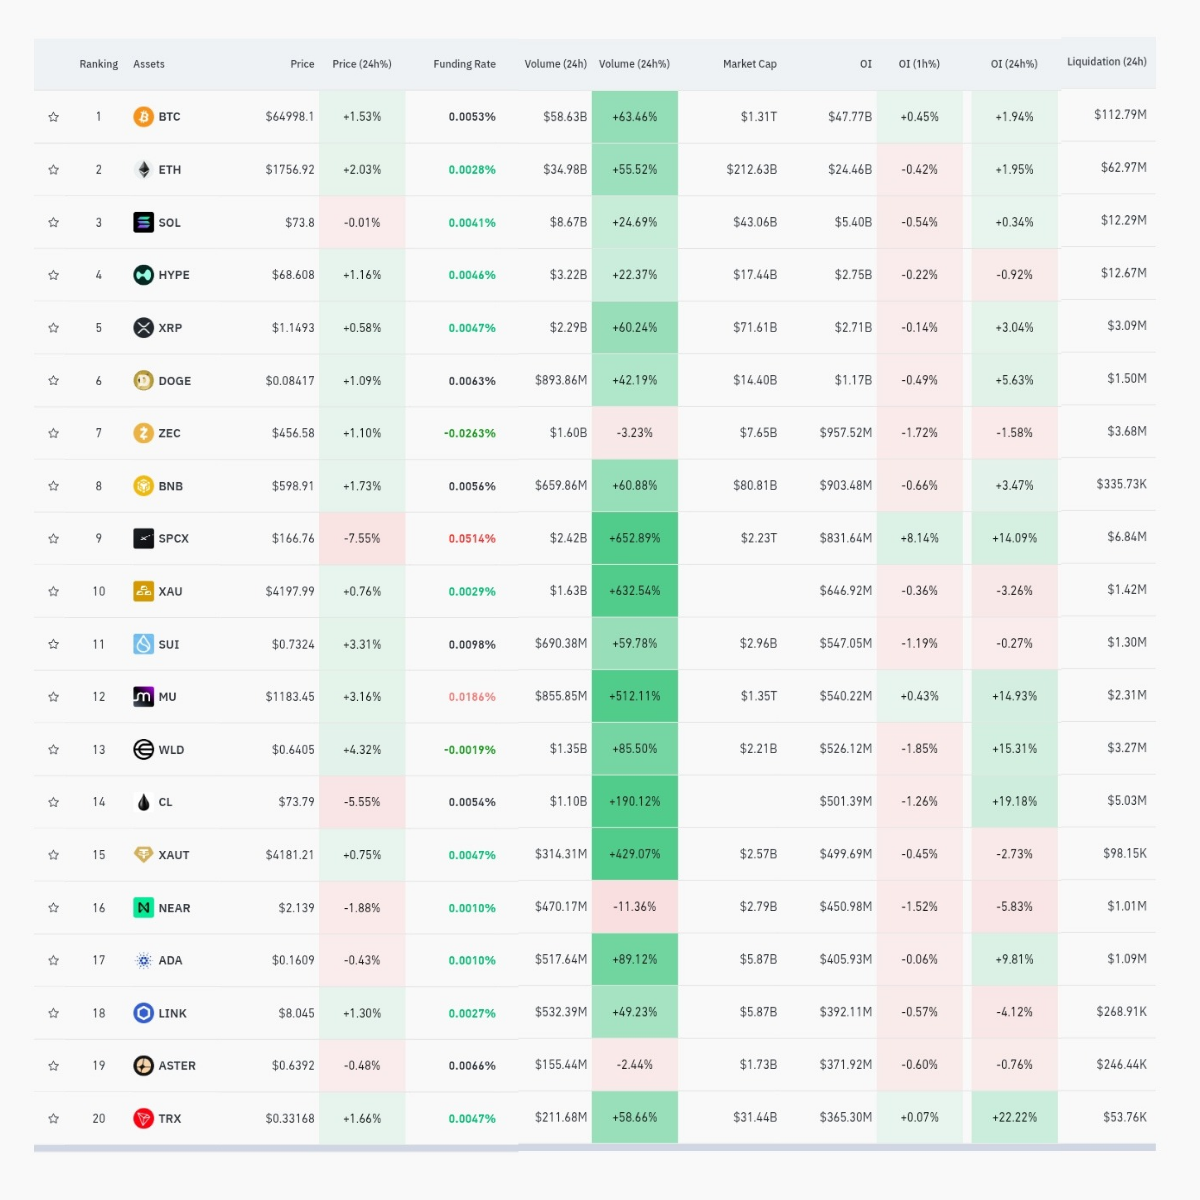
In terms of market dominance, bitcoin continues to dwarf top tier altcoins. While BTC hovers around $64,998.10 (+1.53%), the alternative asset space is displaying a mixed, low volatility environment. Ethereum is valued at $1,756.92 (+2.03%) while Solana is trading flat at $73.8 (-0.01%).
Turning to the derivatives sector, Open Interest (OI) the total dollar value of outstanding, unsettled futures contracts is sitting at a hefty $47.77B for bitcoin, up slightly by +1.94% over the last 24 hours. Concurrently, the funding rate remains stable and remarkably low at 0.0053%, while total forced liquidations reached $112.79M in the past day. This elevated Open Interest level serves as an important reminder that massive market volatility can be triggered at any moment.
My Opinion
Given the impending political deadlines in the US combined with the current on chain metrics, bitcoin’s sideways price correction makes perfect sense; financial markets inherently despise a regulatory vacuum. The CLARITY Act functions as a classic double edged sword. On one hand, restricting daily interest yields on stablecoins is a deliberate measure to safeguard the liquidity of traditional commercial banks against mass deposit migration. On the other hand, drawing a definitive legal boundary between the SEC and the CFTC will provide a massive green light for traditional financial powerhouses to safely deploy capital into digital assets.
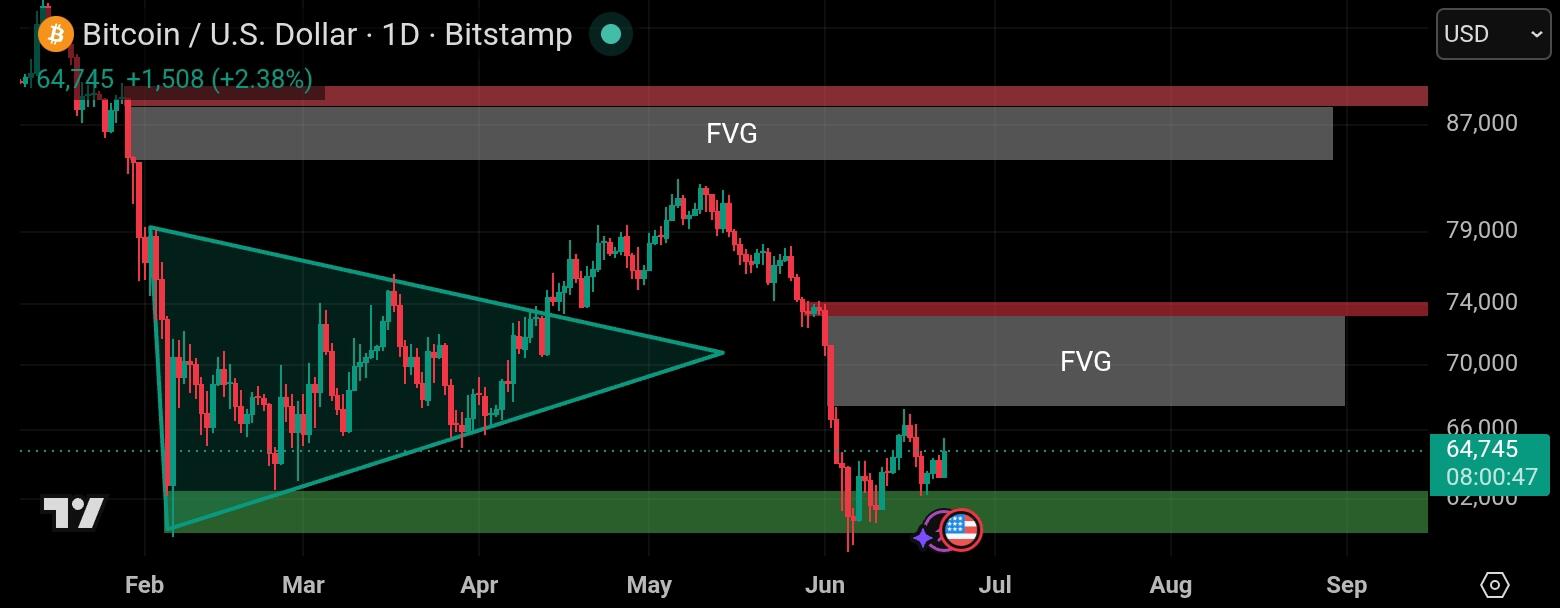
Currently, the probability of this bill passing before the summer recess is a true 50 - 50 coin toss. As long as Bitcoin successfully defends and consolidates above the $60,000 threshold, this remains a prime zone to establish a structured risk management strategy while keeping a sharp eye on incoming updates from the Senate floor.
Click here to read my authentic and original analysis
Source