
Whether you're new to trading or a seasoned investor, learning chart patterns can significantly enhance your ability to make informed decisions and manage risk effectively. Here's why chart patterns are crucial for any trader:
Trend Identification
Chart patterns serve as a visual representation of market movements, helping traders identify ongoing trends. By analyzing these patterns, traders can determine if a market is in a bullish, bearish, or consolidating phase:
-
Bullish Patterns: Such as the Inverse Head and Shoulders or Cup and Handle, signal a continuation or reversal into an upward trend, suggesting buying opportunities.
-
Bearish Patterns: Patterns like the Head and Shoulders or Double Top indicate a downward trend or reversal, signaling potential selling or short-selling opportunities.
-
Consolidation Patterns: Patterns like Triangles or Pennants reflect a consolidating market, indicating a potential continuation or reversal after a breakout.
 Head & Shoulders
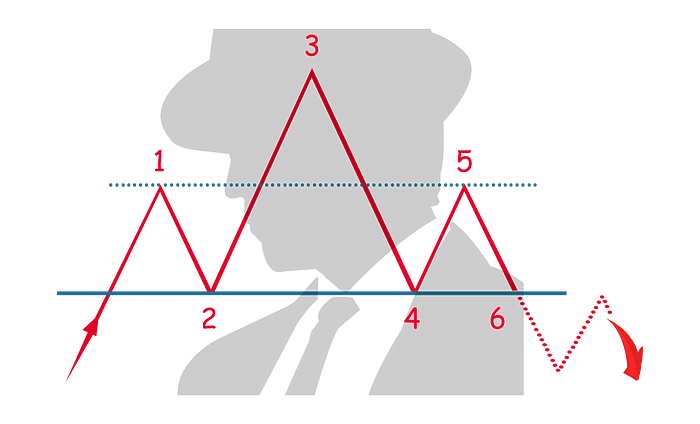
1. Head and Shoulders Pattern
The Head and Shoulders pattern is a classic reversal pattern signaling a trend shift from bullish to bearish or vice versa. It consists of three peaks: the first and third (the shoulders) are of similar height, while the middle peak (the head) is higher.
The neckline, formed by connecting the troughs between the peaks, acts as a support or resistance line. When the price breaks through this neckline, it indicates a reversal is underway.
Usage: Traders can capitalize on this pattern by short-selling at the breakout of a bearish Head and Shoulders pattern, or buying at the breakout of an Inverse Head and Shoulders pattern.
 Double Top
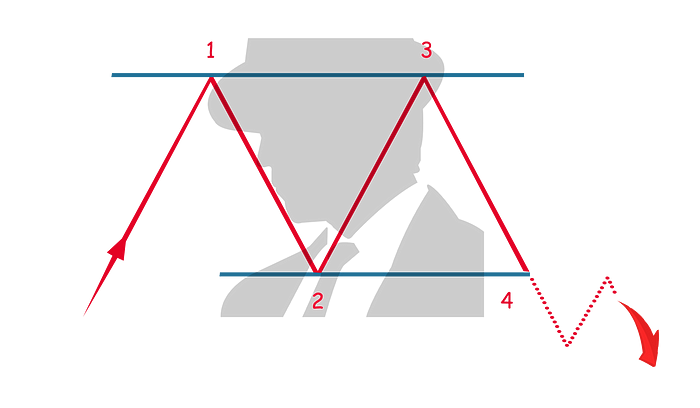
2. Double Top and Double Bottom Patterns
These patterns signal potential trend reversals, resembling a “W” (Double Bottom) or an “M” (Double Top). In a Double Top, prices rise to a resistance level twice, failing to break through, and then reverse downward. A Double Bottom occurs when prices hit a support level twice, failing to drop further, and then reverse upward.
Usage: Traders can look for these patterns at market extremes. A breakout below the neckline of a Double Top signals a potential short position, while a breakout above the neckline of a Double Bottom signals a buying opportunity.
 Ascending Triangle
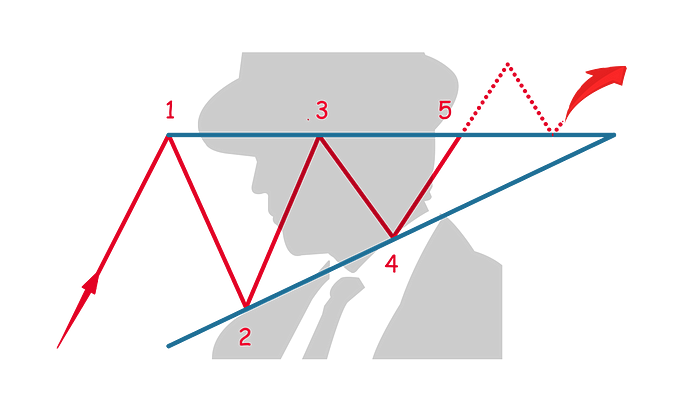
3. Triangles: Ascending, Descending, and Symmetric
Triangle patterns signal consolidation, often leading to the continuation or reversal of a trend. They can take three forms:
- Ascending Triangle: Forms when there’s a horizontal resistance level and an ascending trendline of higher lows. A breakout above the resistance line usually signals a bullish trend continuation.
- Descending Triangle: Forms with a horizontal support level and a descending trendline of lower highs. A breakout below the support level often signals a bearish trend continuation.
- Symmetric Triangle: Forms when two converging trendlines indicate a consolidation phase. A breakout in either direction signals a continuation in that direction.
Usage: Traders can take positions in the direction of the breakout, or consider symmetrical triangles as a potential signal for trend continuation or reversal.
 Bullish Pennant
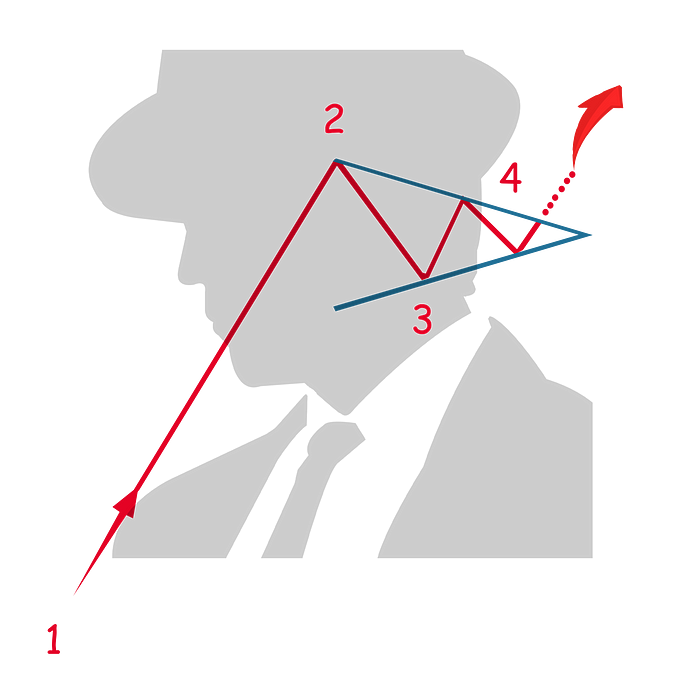
4. Flags and Pennants
These patterns typically indicate a continuation of the existing trend after a brief consolidation period.
- Flags: Formed by parallel trendlines in a downward or upward direction, signaling a temporary counter-trend to the primary movement.
- Pennants: Resemble small symmetrical triangles, indicating a short consolidation phase.
Usage: When prices break out from a Flag or Pennant, traders can enter positions in the direction of the primary trend.
 Cup & Handle Pattern
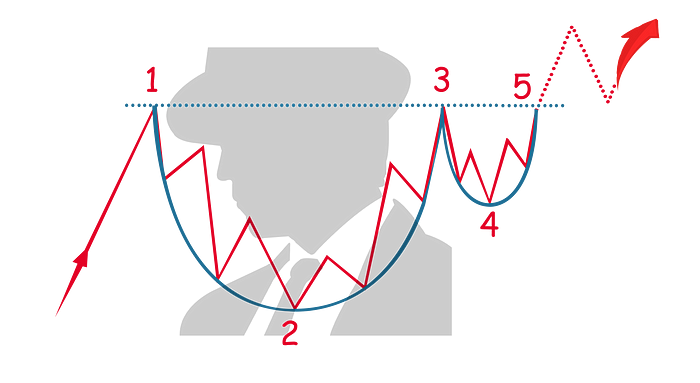
5. Cup and Handle Pattern
This bullish continuation pattern resembles a teacup, with a rounded “cup” followed by a smaller “handle.” The handle indicates a minor consolidation, often leading to a breakout in the same direction as the initial uptrend.
Usage: Traders can look for a breakout above the handle’s resistance level to enter a long position, anticipating a continuation of the previous uptrend.
Conclusion
Knowing your crypto trading patterns is an invaluable tool for crypto traders, helping to provide insight into potential reversals or trend continuations.
Learning chart patterns is an indispensable skill for traders in the crypto market. By mastering these patterns, traders gain valuable insights into trend identification, optimal timing for trades, risk management strategies, and market psychology. Combined with other technical indicators, chart patterns offer a comprehensive approach to trading, helping traders navigate the market confidently and successfully.
Mastering these five key patterns can significantly enhance your ability to navigate the crypto market’s volatility. With practice, you will be able to easily identify patterns without hesitation.
Good luck with your trading.
Richard.


