The growth of volatility in the cryptocurrency market has not occurred. Many assets are still "trapped" in the framework of the side corridors. Of course, we can only talk about a powerful movement with the breakdown of these ranges. The daily chart of Bitcoin does not yet signal a downward movement, although the reluctance of the market to grow may also indicate the weakness of buyers.
Bitcoin
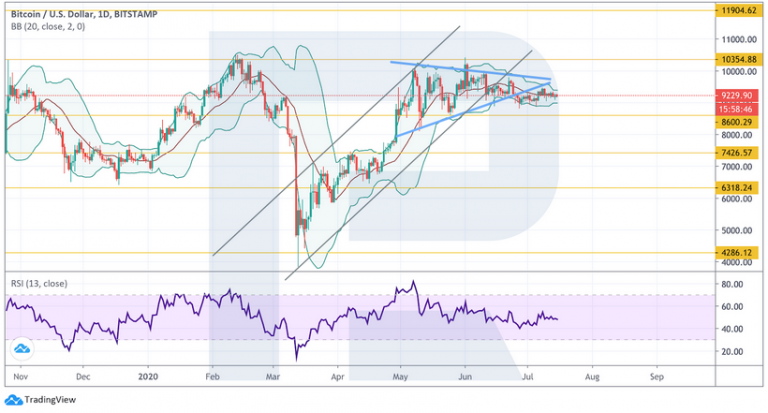
On the daily chart, Bitcoin continues to remain under the lower border of the "Triangle" model, which indicates pressure from sellers of the asset, as well as the continuing potential for a fall to the level of $7425.
Confirmation of this idea will be the breakdown of the support area and the consolidation of quotes under the $8600 level, below which the price did not fall. In General, the current movement is within the range. As a rule, in the case of a breakout of the channel border, you can postpone the height of the range from the breakout point to determine the price benchmark.
If prices can now consolidate below the level of $8600,we can safely say that the fall to the level of $6320 will continue.
Canceling the negative option for buyers will be a breakdown of the upper limit of the range and fixing the price above $10355.