
We are all worried about what will be next move for cryptocurrency markets.
Spending time studying charts it's every time the best, so we all know that history repeat itself even with slightly different patterns or proportions or intensities.
I focused on 2013 trend and found out that is there that we are! We are in 2013? You would ask me. I would answer Yes! Charts repeat themselves in a kind of repeated and fractal way. You know that you can find the move that you see in the day chart in the 1 minute chart? I will talk about that in the next post.
So here we are!

So you can see how the the two conditions are similar, and how much the value of Bitcoin has fallen in both moments that were/are the mid term of the bull run. Similar relations could happen between cycle modality and number. As well the pattern of Cycle n. 1 is quite similar to 2nd part of cycle n. 3; and cycle n. 2 could be associated with cycle n. 4.
These are the differencies between the two moments (2nd and 4th cycle):
In 2013 the price was always higher than Stock/Flow charts at 463 days (thanks @BuyBTCww and @100trilionUSD). It would have lied on Stock/Flow model chart only after the end of the bull run.
On the contrary in 2021 Bitcoin price has quite followed the Stock/Flow charts at 463 days, "like a drunk that always find the way back home".
Following this argument we can find out that time to detach from the Stock/Flow model chart is yet to come.
But let's find out better were we are now!


In these charts takes life my hipotesys that we are in a mid-bull run dump. Let's see now what happened in these months.
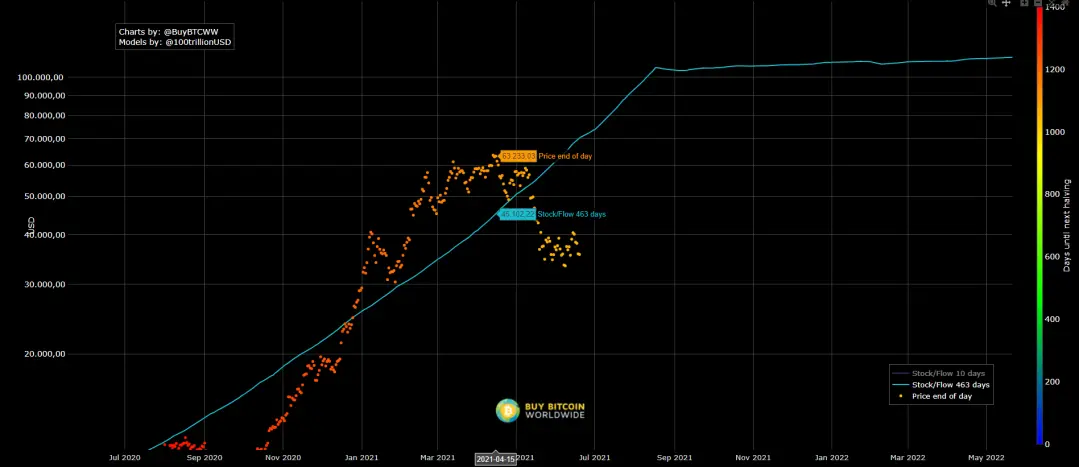
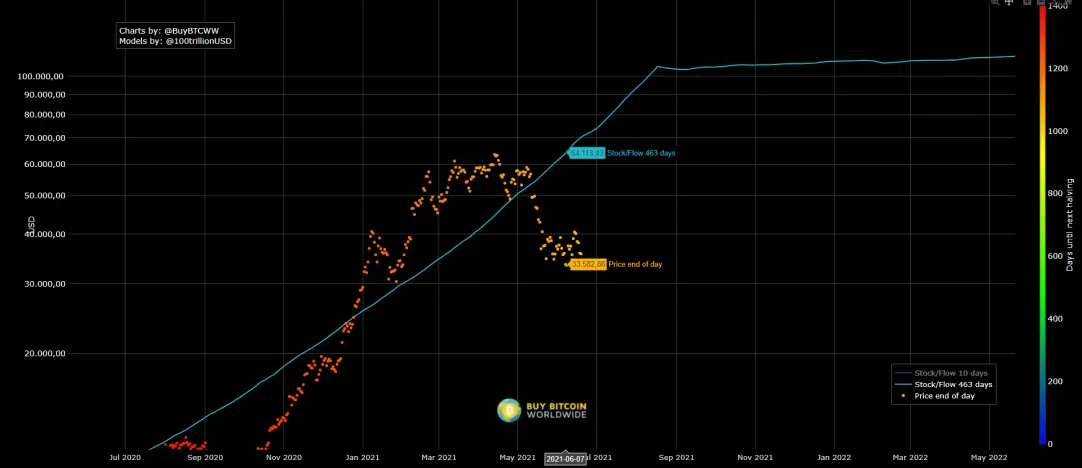
In 15th of April, current year we had a correct price of Bitcoin of about $ 45.000 while real price was about $ 63.000; while on 7th of June we had a correct price of Bitcoin of about $ 65.000 while real price was about $ 33.000.
What does it means? Remember the composite man of Wykoff's theories, in which a single unit controls market. In this way we can hypothesize that the price has been dumped in the mid bull run term to get higher prices at the end of the bull run.
Correct price for bull run end is $ 100.000 for bitcoin; but with this dumping move $ 150.000 is likely more achievable.
Glad to write here my first post, I remeber to you that I'm not a financial advisor and that's only my opinion!






