
The crab walk (sideways price action) is one of the most annoying times for traders and investors. Cryptocurrencies have been crab-walking since March of this year.
Typical momentum algorithms lose small amounts to the chop. Is there a solution here?
There is … and what I’m going to outline here is a trading system that has historically made money during crab walks. A detailed video explanation is being rolled out on our 1.2 Labs Patreon account. But for now, let me describe it in outline.
To begin, it has 2 key ingredients: time scale change + data change.
Cryptocurrencies are volatile enough that you can “zoom in” on a daily time frame to get ample trading opportunities. This is going to be a day-trading strategy, so you need the 1 minute time-frame.
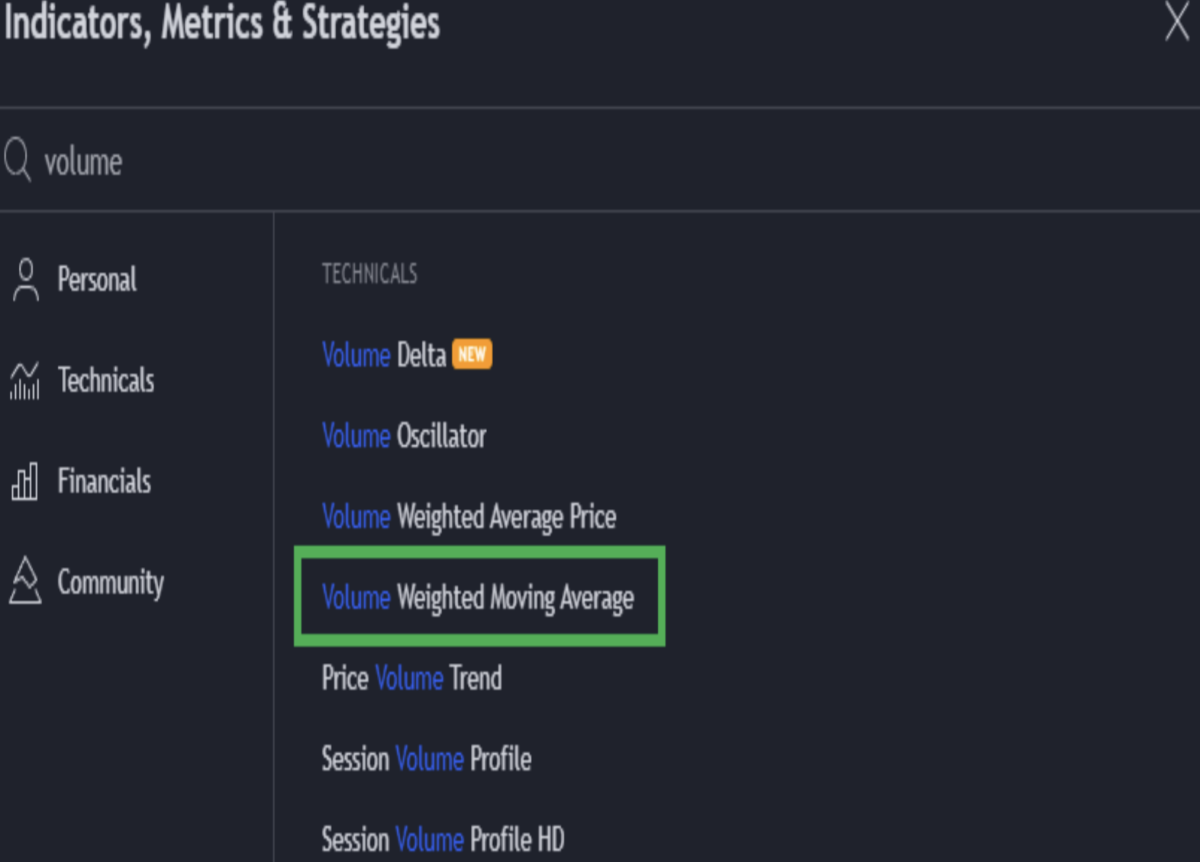
Next, you’ll need a different indicator than we’ve discussed previously, namely a volume weighted moving average.
To recall, a simple moving average is calculated as:
- Average of (price per unit of time)
- Example: average of the price for each of the last 200 days (= SMA 200)
The volume weighted moving average is:
- Average of (price per unit of time X volume per unit of time)
- This is the VWMA 200
In other words: price only matters if it also has volume. As a result, the moving average responds more when there is volume and less when there isn’t.
You can add this indicator to anything in TradingView by searching for it.
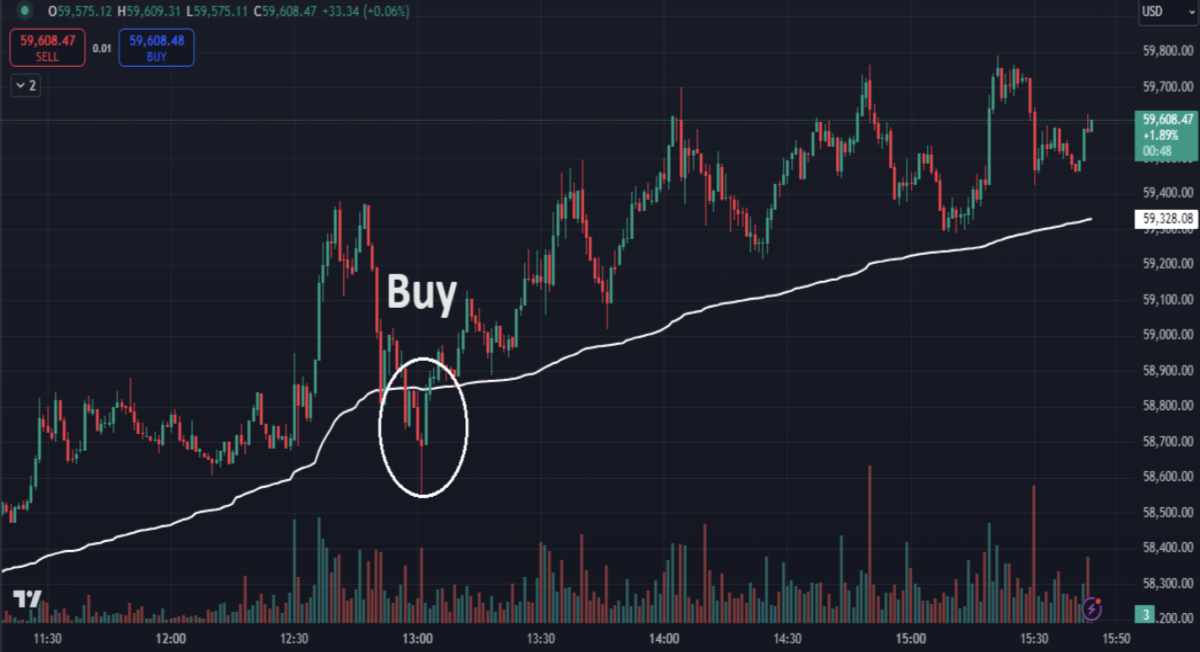
The simplest approach is to use the 200 minute VWMA as your signal. Buy when the minute price closes above and sell when it closes below. As in the example below (using BTC).
You’ll notice that there are long 3 - 8 hour stretches where the price does not cross that line. So, you might feel as though you are missing out. What you can do, should you really want to trade, is use a faster indicator paired with your slower indicator.
For example, add the VWMA 50. Now you have two indicators and there will be a gap between them. The idea would be to buy when the price closes below the VWMA 50 but remains above the 200. Sell when it closes again below the VWMA 200.
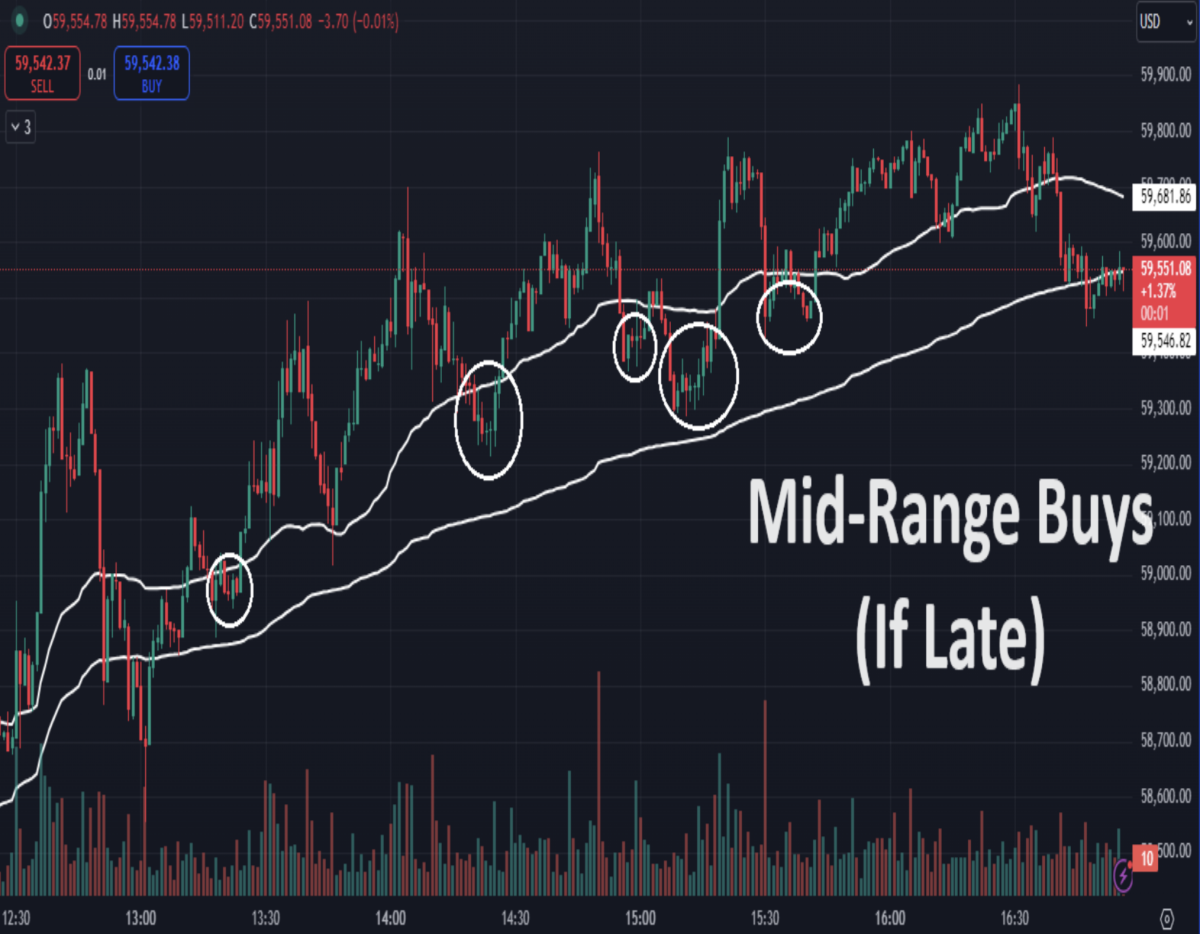
Yes, that means you do have a bit more risk when buying in the “between” zone, but for a long run, especially in a good mood type day, it typically does well.
Do the opposite for short trades.
Now that you understand the basic idea, let’s talk about two important drawbacks–apart from the fact that this is an active trading strategy that requires you to stare at your screen all day long.
Beyond the active trading requirement, the greatest difficulty for the VWMA 200 is that it allows for too much volatility, and that means that you are giving up quite a bit in potential returns.
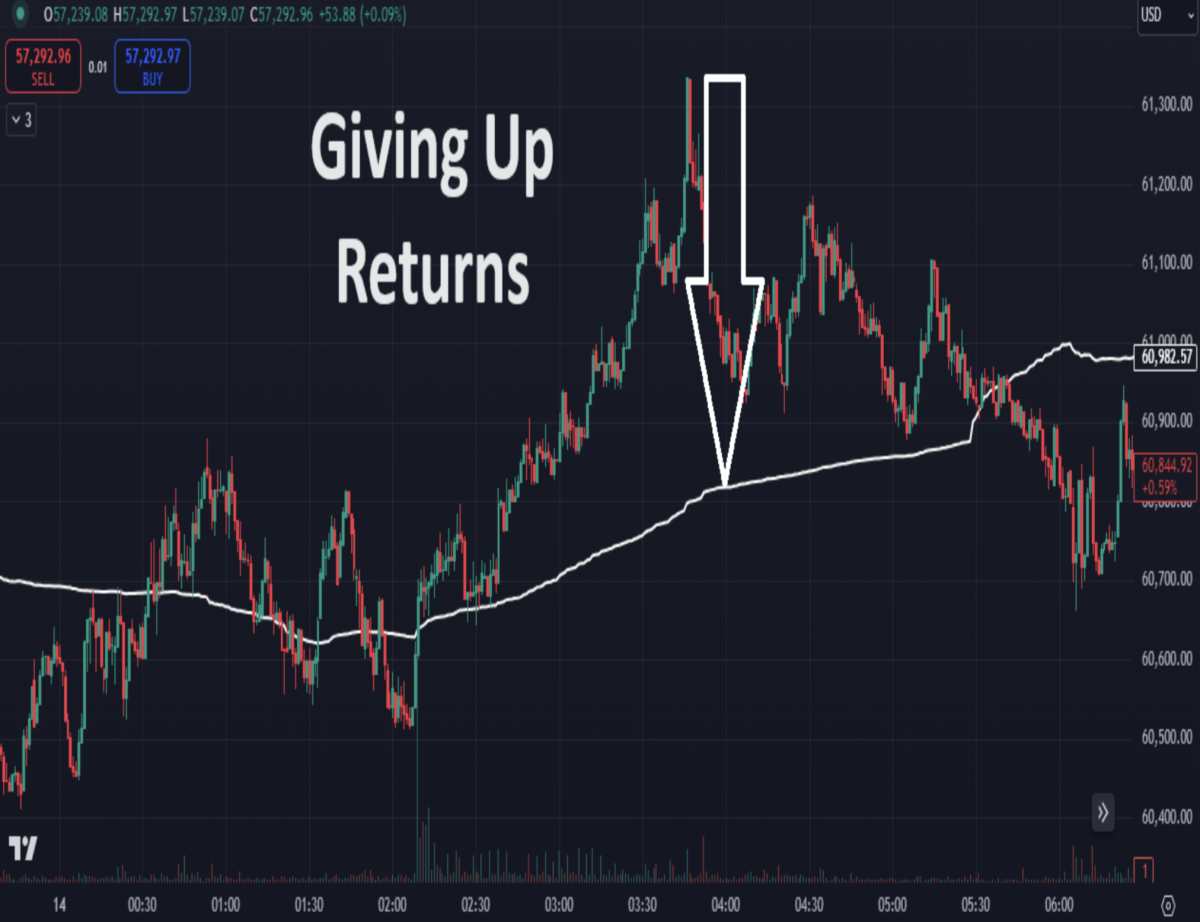
The standard solution is to take profits along the way, but how?
One approach is to check for historical deviations over the past 3 days – just scroll back for the max % distance the price closed above or below the VWMA 200 before it started giving back gains. The image above is an example.
Typically, you’ll find that the deviation above the VWMA 200 line is, at max, between 1% and 4%. For BTC it’s typically 1%. For SOL, it’s typically 2%. With meme coins you’ll find 8% or more at times.
Aim to take gains so that your returns for the trade are roughly 50% of that range. If you see a standard 2% max distance, then aim for a 1% return on your trade and start taking gains that might average out to that return. For example, you might start taking gains at 0.5%, 1%, 1.5% and 2%.
- And remember, these are early profit taking targets.
- If it doesn’t reach one of those targets, then sell when the price closes below the VWMA 200.
This topic raises questions around a second drawback. Just how much does this return?
I know that a 1% return might not sound like a lot. But even an average 0.25% daily gain = ~7.7% monthly. That would turn $10,000 into better than $24,000 by year’s end.
And because this strategy works for long and short positions, you can make money basically every day. While Dom and I were workshopping this explanation, we made a bit over 3% on a ~$250,000 position in an hour (= ~$7,500) trading BTC short. And it’s always nice to post gains when the market is declining.
Like most trading, this requires a bit of skill. I’ve only outlined the idea. If you decide to try it out, you’ll find your own way to adjust it to your temperament. I also recommend that you start with small amounts so that your errors are less costly.
Still, it’s a start at a strategy that our team has found does well in crab markets. We'll be trading it on our DeBank wallet soon too – likely on BASE, using ETH and (probably) BRETT. So, more details to come.
Happy Trading!
👉Subscribe to our Free Investment Bulletin.
Finally, if you learned something, hit that UP ARROW ⬆️ and SHARE. 🔁


